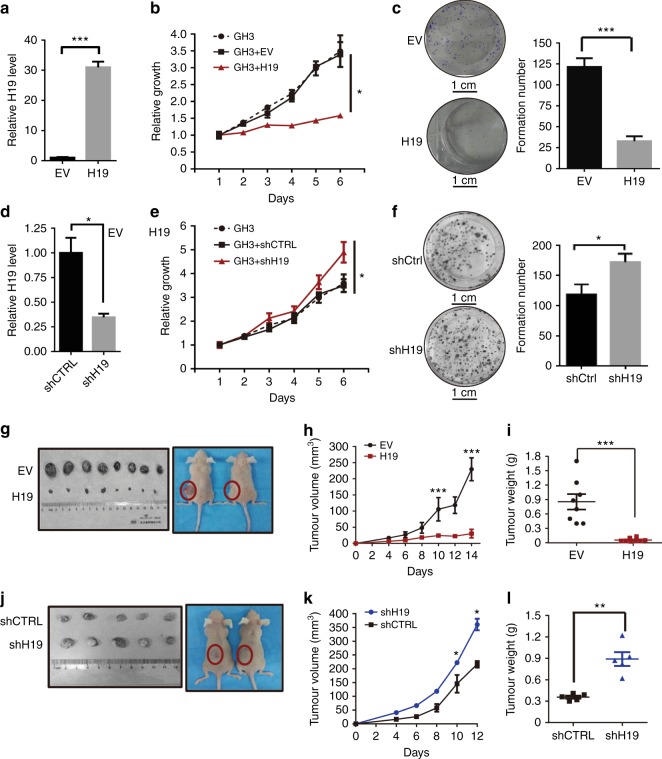
Fig. 2.
H19 inhibits the growth of pituitary tumours both in vitro and in vivo. a H19 is stably expressed in GH3 cells with a lentiviral H19 overexpression construct but not in those with a control EV. The H19 level was monitored by qRT-PCR and normalized to GAPDH expression. b H19 overexpression inhibits GH3 cell proliferation in vitro. For 6 days, cell viability was periodically measured with an MTS assay (n = 5, *p < 0.05). c H19 overexpression suppresses the colony formation rate of GH3 cells. Cells were seeded into a six-well plate with 200 cells per well and cultured for 10 days, followed by crystal violet staining and colony counting (scale bar,1 cm, ***p < 0.001). d GH3 cells were infected with lentiviral H19 shRNA or a control shRNA. H19 RNA levels were measured by qRT-PCR and normalized to GAPDH. e H19 knockdown enhances GH3 cell proliferation. For 6 days, the proliferation of GH3 cells infected with lentiviral H19 shRNA or a control shRNA was periodically analysed with an MTS assay (n = 5, *p < 0.05). f H19 knockdown enhances the colony formation rate of GH3 cells. Cells stably expressing shH19 or a control shRNA were seeded into six-well plates with 200 cells per well and cultured for 10 days, followed by crystal violet staining and colony counting (scale bar, 1 cm, n = 5, *p < 0.05). g H19 overexpression inhibits GH3 tumour growth in vivo. First, 1 × 10⁶ H19-overexpressing GH3 cells (OE group) or control GH3 cells (EV group) were subcutaneously grafted into nude mice. At the end of the experiments, mice bearing tumours were sacrificed, and the tumour tissues were collected, photographed (g) and weighed (i, ***p < 0.001). h The growth of xenograft tumours was measured by tumour volume every other day (volume = width2 × length × 1/2). j H19 knockdown accelerates GH3 tumour growth in vivo. In total, 1 × 10⁶ H19 stable knockdown GH3 cells (shH19 group) and control GH3 cells (shCTRL group) were subcutaneously grafted into nude mice. At the end of the experiments, mice bearing tumours were sacrificed, and the tumour tissues were collected, photographed (j) and weighed (l, **p < 0.01). k The growth of xenograft tumours was measured by tumour volume every other day (volume = width2 × length × 1/2). Error bars are the mean ± SEM values. Two-tailed Student’s t-test was used for statistical analysis

