Fig. 5.
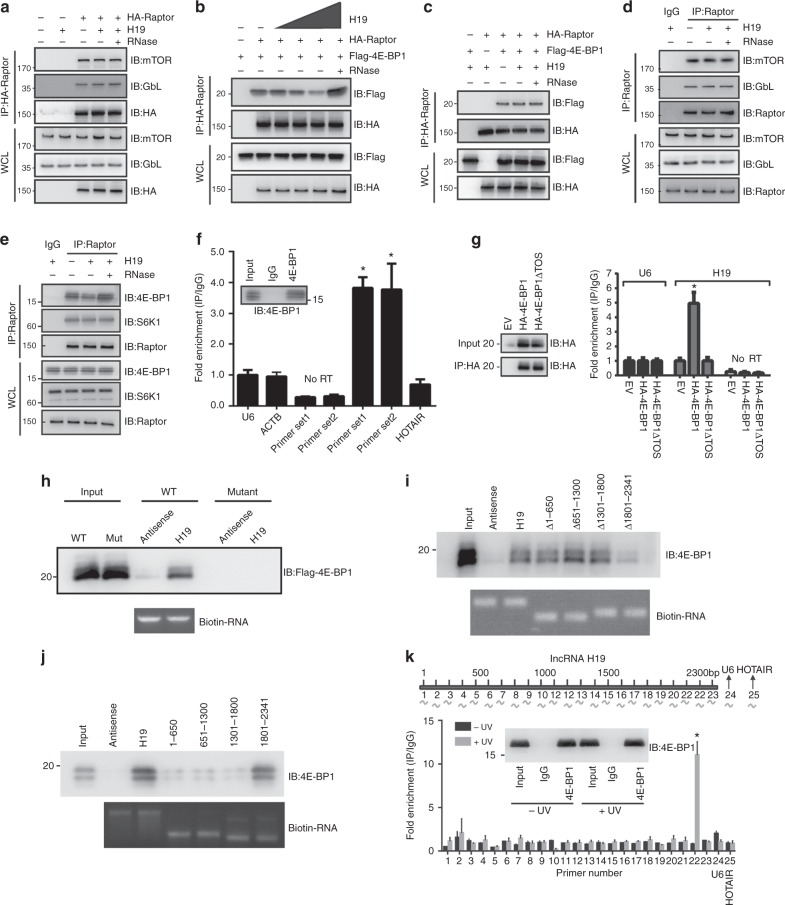
H19 represses 4E-BP1 binding to Raptor by masking the 4E-BP1 TOS motif. a–c Immunoblot analysis of whole-cell lysates and immunoprecipitates derived from GH3 cells transfected with the indicated constructs. The RNase treatment group was used as the negative control. d H19 overexpression does not affect mTORC1 integrity detected by endogenous co-immunoprecipitation. e H19 disrupts the endogenous interaction between 4E-BP1 and Raptor. f H19 associates with 4E-BP1 in GH3 cells. Whole-cell lysates of GH3 cells were immunoprecipitated with anti-4E-BP1 antibody or control IgG. The immunoprecipitation was analysed for the presence of H19 via qRT-PCR. Two sets of H19 primers 1 and 2 were used to detect the N- and C-termini, respectively, of full-length H19. Signals were normalized to U6 RNA. Mean ± SD are shown, n = 3. *p < 0.05. g Full-length 4E-BP1, but not TOS domain-deleted 4E-BP1 protein, associates with H19. Anti-HA immunoprecipitation derived from GH3 cells transfected with the indicated HA-4E-BP1 constructs was analysed for the presence of H19 by qRT-PCR. Signals were normalized to U6 RNA. Mean ± SD are shown, n = 3. *p < 0.05. h H19 transcripts and H19 antisense were labelled with biotin and incubated with GH3 whole-cell lysates expression flag-4E-BP1 and flag-4E-BP1 TOS deletion mutant proteins. The capacity of H19 binding to 4E-BP1 proteins was analysed by immunoblotting. i The 3′ region of H19 is responsible for 4E-BP1 binding. Full-length and a series of H19 deletion mutants incubated with GH3 whole-cell lysates. The capacity of H19 binding to 4E-BP1 proteins was analysed by immunoblotting. j A series of biotinylated H19 fragments (1–650, 651–1300, 1301–1800, 1801–2341) were transcribed in vitro and utilized in the RNA pull-down assay with GH3 cell lysates. The retrieved protein was analysed by immunoblotting. k CLIP of 4E-BP1-bound H19 RNA in GH3 cells. RT-qPCR was used to identify the region in H19 bound by 4E-BP1 protein. Location of primer pairs along the H19 RNA indicated in the diagram above. The amount of immunoprecipitated RNAs in each sample is represented as signal relative to the negative (IgG) sample. Mean ± SD are shown, n = 3. *p < 0.05

