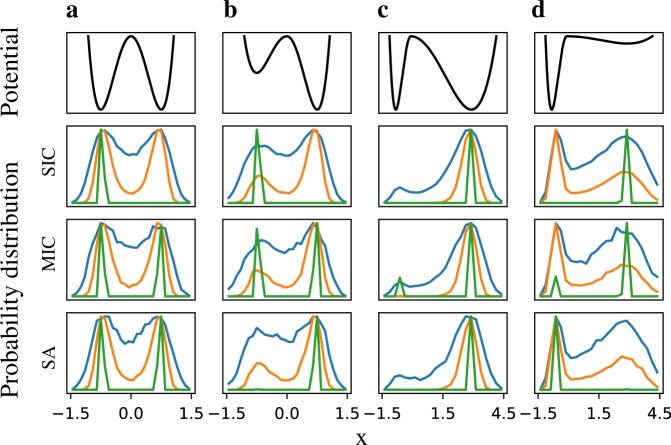
Fig. 2.
Tests of the stochastic analysis methods using double-well potentials. First row shows four variants of double-well potentials. a The two wells have identical stability as well as the basins of attraction; b the left well has lower stability than the right well, but their basins are same; c two wells have same stability but asymmetric basins with the right well having a larger basin, and d the two wells differ in stability as well as basins such that the left well is more stable but has a smaller basin of attraction. The 2nd–4th rows show the histogram of the steady states for different sampling schemes, namely, single initial condition (SIC, 2nd row), multiple initial conditions (MIC, 3rd row) and simulated annealing (SA, 4th row) for each of the four potentials and at three different noise levels—high (blue), intermediate (orange) and low noise (green). All of the methods converge for the high and intermediate noise levels whereas, for the low noise, the particle is trapped in a random well in the SIC scheme, MIC captures the basin of attraction of the wells and SA captures the most stable well. The equations, parameter values and figures for other noise levels (Fig. S1) are available in SI

