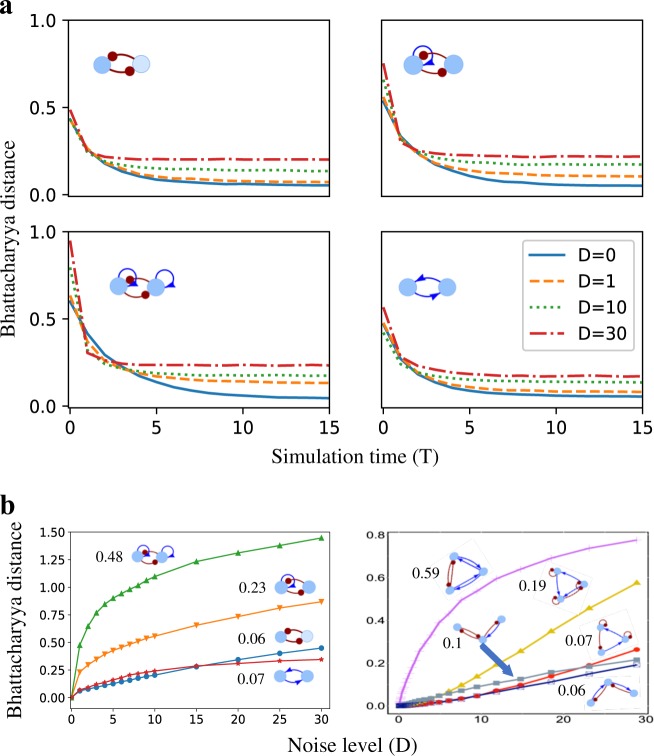
Fig. 5.
Response time and noise robustness of gene regulatory circuits a Tests were performed on a toggle switch circuit. The Bhattacharyya distance (BD) was calculated between the probability distribution of the gene expression sampled at the end of the simulations (simulation time, T = 50) for 106 models at zero noise (D = 0) and the probability distributions at different time points during the simulations for different noise levels. The BD value for D = 0 approaches zero after T = 15, indicating that the models have converged to steady-state solutions. Simulations with larger noise converge faster, though BD is larger. b The response of BD with respect to the noise levels for toggle-switch-like circuits (left panel) and some three-gene circuits (right panel). The numbers indicate the noise robustness (BD at D = 1.0) of different circuits

