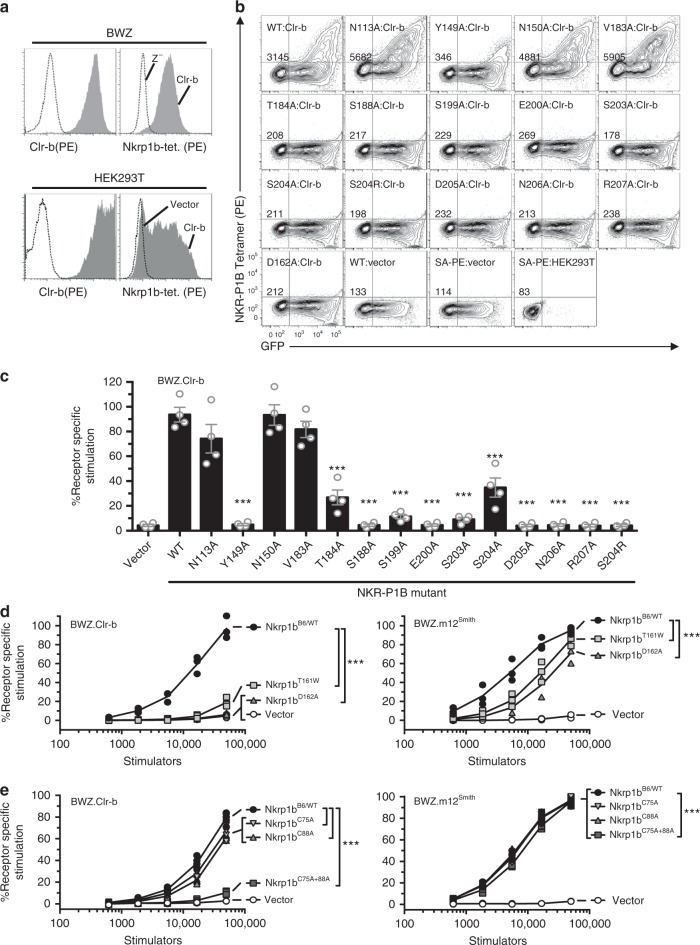
Fig. 5.
Energetic basis of the NKR-P1B:Clr-b interaction. a BWZ cells (top) or HEK293T cells (bottom) were transduced or transfected, respectively, with empty vector (dashed line) or Clr-b-expressing vector (shaded gray), and stained using anti-Clr-b antibody (left) or NKR-P1B tetramers (right) and analyzed by flow cytometry. b HEK293T cells were transfected with vector expressing Clr-b (pIRES2-EGFP), and 48 h later were stained with NKR-P1B mutant tetramers. The GFP expression measures transfection efficiency and PE measures binding by PE-tetramers. Gates were set up using untransfected cells (HEK293T) and cells transfected with empty pIRES2-EGFP (Vector) that were stained with NKR-P1B tetramer (WT) or Streptavidin-PE (SA-PE). Labels on the top left correspond to point mutation on the NKR-P1B molecule, whereas italicized numbers correspond to mean fluorescence intensity of NKR-P1B. c Cells were transfected with constructs expressing NKR-P1B mutants, and 48 h later were used as stimulators to BWZ.CD3ζ/Clr-b reporters. Co-cultures were setup using a 1:1 stimulators: reporters ratio, and the next day were assayed for production of β-galactosidase using colorimetric assay. d, e NKR-P1B dimer mutants were transfected into HEK293T cells and used in BWZ assays using 3-fold dilutions of stimulators against BWZ.CD3ζ/Clr-b reporters (left) or BWZ.CD3ζ/m12Smith reporters (right). Significant differences are shown between the WT and mutant allele for each graph. Data were analyzed using (c) one-way ANOVA [F(15,48) = 51.88, p < 0.0001], (d) two-way ANOVA (Z.Clr-b: [F(12,40) = 64.14, p < 0.0001]; Z.m12: [F(12,40) = 21.71, p < 0.0001], or (e) two-way ANOVA (Z.Clr-b: [F(16,64) = 389.3, p < 0.0001]; Z.m12: [F(16,80) = 1297, p < 0.0001] with Bonferroni post-hoc tests. Significance intervals are depicted as ***p < 0.001. (b) is representative of 2 independent experiments. All other data are representative of at least 3 independent biological replicates. Data are presented as mean ± SEM

