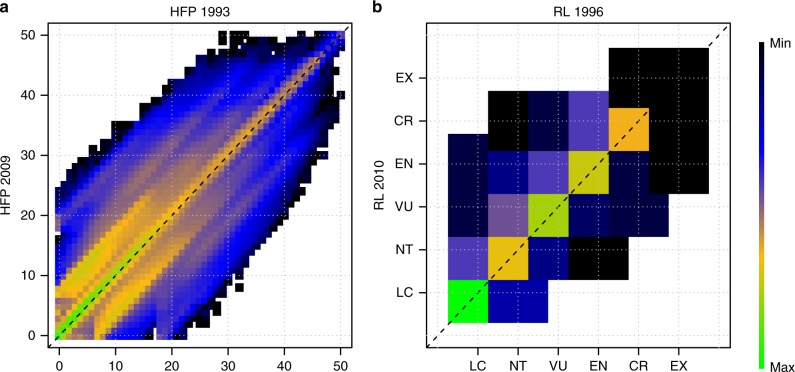
Fig. 2.
Recent changes in terrestrial human footprint and species extinction risk. a Shows a transition matrix in which any position represents the initial (x axis) and final (y axis) human footprint value (from 0 to 50) of global 1 km terrestrial grid cells; the colour scheme represents the number of individual cells in each particular transition state. b Shows a transition matrix in which any position represents the initial (x axis) and final (y axis) extinction risk category (from Least Concern to Extinct) of terrestrial mammal species; the colour scheme represent the number of individual species in each particular transition state

