
Fig. 4.
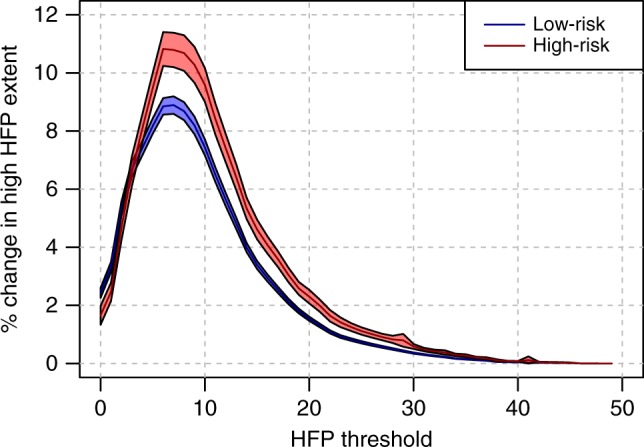
Changes in the overlap between species ranges and high human footprint values over time. The lines report the average change in the overlap between species ranges and human footprint values bigger than any given threshold. Different lines refer to species in the low-risk or high-risk categories, as reported in legend. The shaded areas around the lines represent the 95% standard credible interval measured across a total of 4421 species