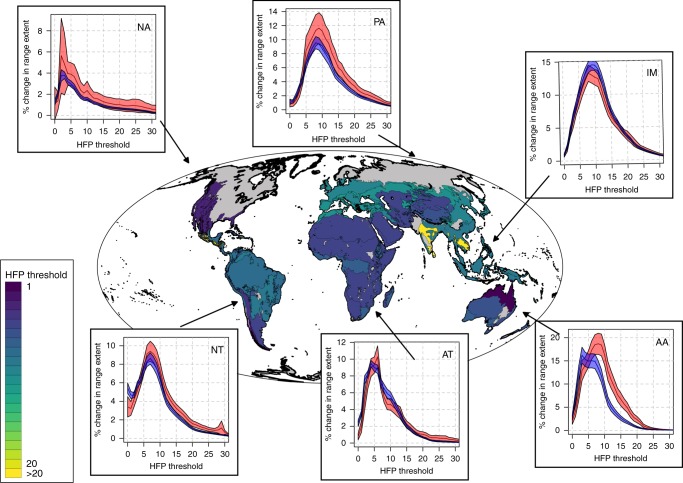
Fig. 6.
Changes in the overlap between species ranges and high human footprint (HFP) values for each biogeographic realm*. The underlying map reports, for each biome within each realm, the threshold at which change in HFP values is the highest for high-risk species. The plots report the average change in the overlap between species ranges and HFP values bigger than a given threshold within each realm (with high-risk species in red and low-risk species in blue). The shaded areas around the lines in the plots represent the 95% standard credible interval measured across a total of: 493 AA species, 854 AT species, 604 IM species, 259 NA species, 949 NT species, 442 PA species*. *Realm acronyms: AA Australasia, AT Afrotropical, IM Indomalay, NA Nearctic, NT Neotropical, PA Palearctic

