Fig. 5.
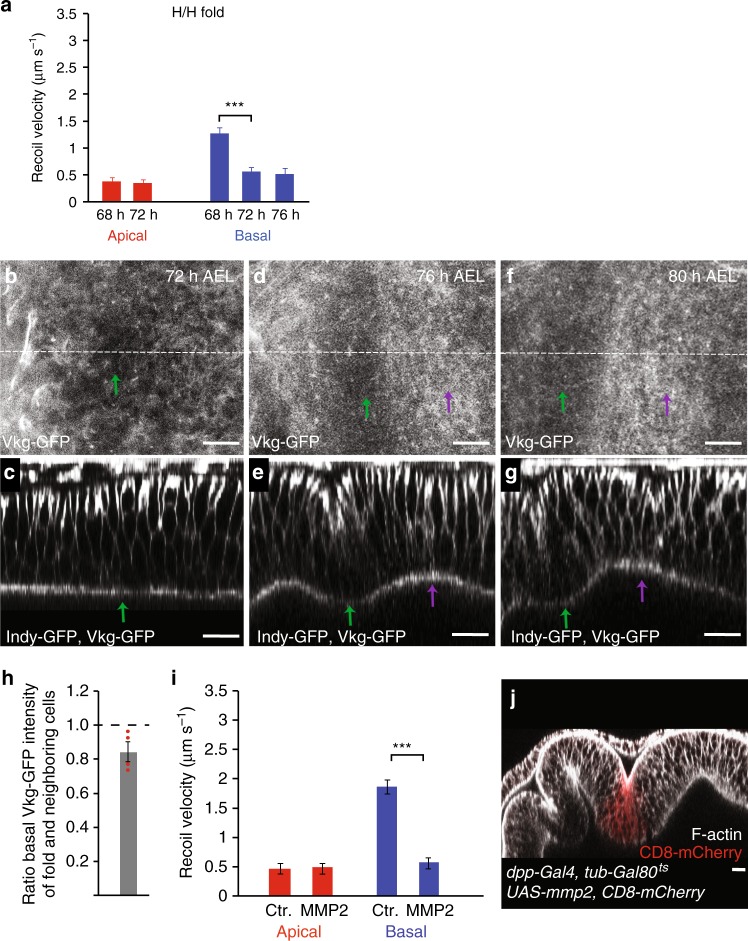
Local reduction of ECM and basal tension in H/H fold. a Average recoil velocity of the two vertices at the end of an ablated cell edge in the H/H pre-fold region within 0.25 s after ablation for wing imaginal discs of the indicated times AEL. Recoil velocities are shown for ablations of apical and basal cell edges, as indicated. Mean and s.e.m. are shown (n = 15 cuts) (***p < 0.001, Student’s t-test). b–g Basal (b, d, f) and cross-sectional (c, e, g) views of wing imaginal discs at the indicated stages expressing Vkg-GFP and Indy-GFP are shown. Green and magenta arrows point to the H/H and H/P fold, respectively. Scale bars are 10 μm. h Ratio of basal Vkg-GFP pixel intensity for H/H fold cells and neighboring cells of 72 h AEL wing imaginal discs are shown. Mean and s.e.m. are shown (n = 4 wing imaginal discs). i Average recoil velocity of the two vertices at the end of an ablated cell edge of control cells and cells expressing MMP2 within 0.25 s after ablation. Recoil velocities are shown for ablations of apical and basal cell edges, as indicated. Mean and s.e.m. are shown (n = 15 cuts) (***p < 0.001, Student’s t-test). j Cross-sectional view of a wing imaginal disc expressing MMP2 in a stripe of cells under control of dpp-Gal4 labeled by expression of CD8-mCherry (red). F-actin staining is shown in gray. Larvae were incubated for 24 h at 29 °C before dissection to induce MMP2 expression. Scale bar is 10 μm

