Fig. 6.
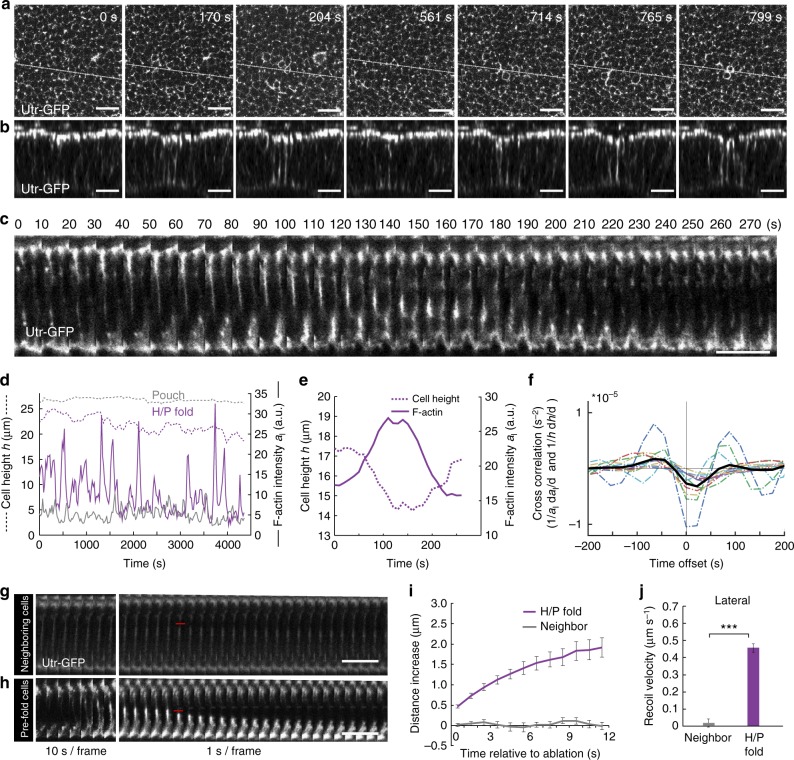
Increased F-actin and tension at lateral cell interfaces in H/P fold. a, b Middle (13 μm below apical surface) XY layer (a) and cross-sectional images (b) of a time-lapse movie of a cultured wing imaginal disc expressing Utr-GFP to label F-actin. The region of the H/P fold is shown. Scale bars are 10 μm. c Kymogram of cross sections of Utr-GFP-expressing cells in cultured wing imaginal discs showing the dynamics of F-actin in H/P fold cells. Scale bar is 10 μm. d Lateral F-actin intensity al (full line) and cell height h (dashed line) for a H/P fold cell (magenta) and a neighboring cell (gray) as a function of time. e Close-up view of lateral F-actin intensity al (full line) and cell height h (dashed line) for a H/P fold cell as a function of time. f Cross correlation function between the relative rate of change of lateral F-actin intensity (1/al) dal/dt and rate of relative height change (1/h)dh/dt as a function of time offset ( as a function of τ). Dotted lines: correlation for twelve individual fold cross sections; black line: average correlation (n = 12). The cross correlation is negative for positive time lags and reaches a minimum for a time lag around 22 s. g, h Kymograms of cross sections of Utr-GFP-expressing neighboring cells (g) or H/P fold cells (h) before and after ablation of a lateral cell interface. Red lines indicate the time and position of the ablation. Scale bar is 10 μm. i Increase of the width of the ablated region along the apical-basal axis upon laser cutting of lateral cell interfaces of H/P fold cells and neighboring cells as a function of time after ablation. Mean and s.e.m. are shown (n = 15 cuts). j Average recoil velocity within 1 s of ablation of lateral cell interfaces of H/P fold cells and neighboring cells. Mean and s.e.m. are shown (n = 15 cuts) (***p < 0.001, Student’s t-test)

