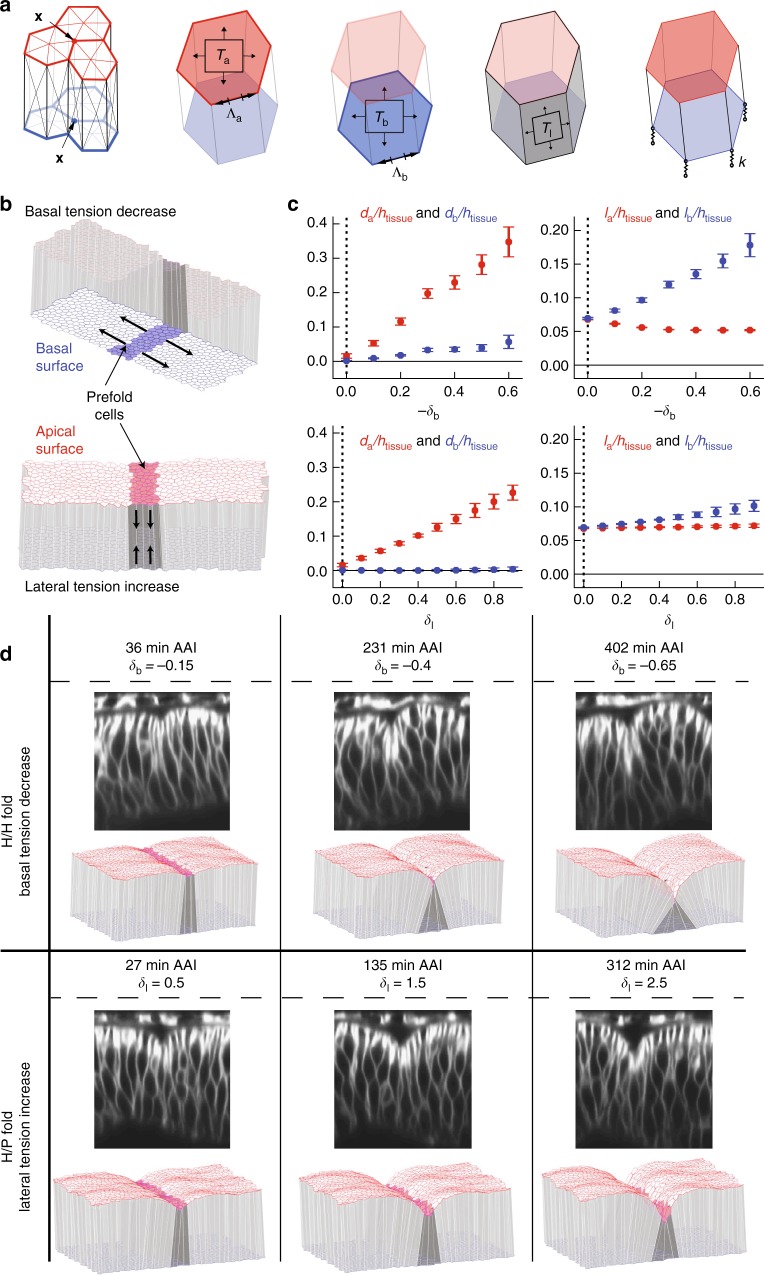
Fig. 7.
3D vertex model simulations of fold formation. a In the 3D vertex model, tissue geometry is represented by a set of apical and basal vertices with positions . Cell volume is conserved. In addition, forces acting on vertices arise from apical, basal, and lateral surface tensions (Ta,Tb,Tl) and apical and basal edge tensions at cell–cell contacts (). Attachment of the basal vertices to the extracellular matrix is represented by elastic springs with spring constant k. b 3D vertex model representation of the wing imaginal disc epithelium. A packing of identical cells is prepared at mechanical equilibrium, with periodic boundary conditions and mechanical parameters chosen to reproduce the cell aspect ratio in wing imaginal discs. Basal edge and surface tensions are taken four times larger than apical edge and surface tensions. A stripe of pre-fold cells is introduced, with either decreased basal surface and edge tensions Tb and (“basal tension decrease”, upper schematic), or increased lateral surface tension Tl (“lateral tension increase”, lower schematic). The tissue configuration is then relaxed to a new state of mechanical equilibrium. c Quantification of tissue shape changes in 3D vertex model simulations of fold formation. Geometric parameters (Fig. 1i) as function of the relative decrease of basal edge and surface tension −δb and relative increase in lateral surface tensions δl within pre-fold cells. Mean and s.e.m. are shown (n = 4 simulations). Vertical dashed line: initial conditions of simulations prior to fold formation. Basal tension decrease and lateral tension increase lead to folds with a pronounced apical indentation and small basal outward deformations, as observed in H/H and H/P folds (Fig. 1n, o). A more pronounced expansion of basal cell cross-sectional length lb is observed for the basal tension decrease, similar to the largest basal expansion observed in the H/H fold compared to the H/P fold (Fig. 1p, q). d Representative experimental images of H/H (top) and H/P (bottom) folds at successive times, and equilibrium shape of 3D vertex model simulations at increasing magnitude of basal edge and surface tension decrease (top) and lateral tension increase (bottom)

