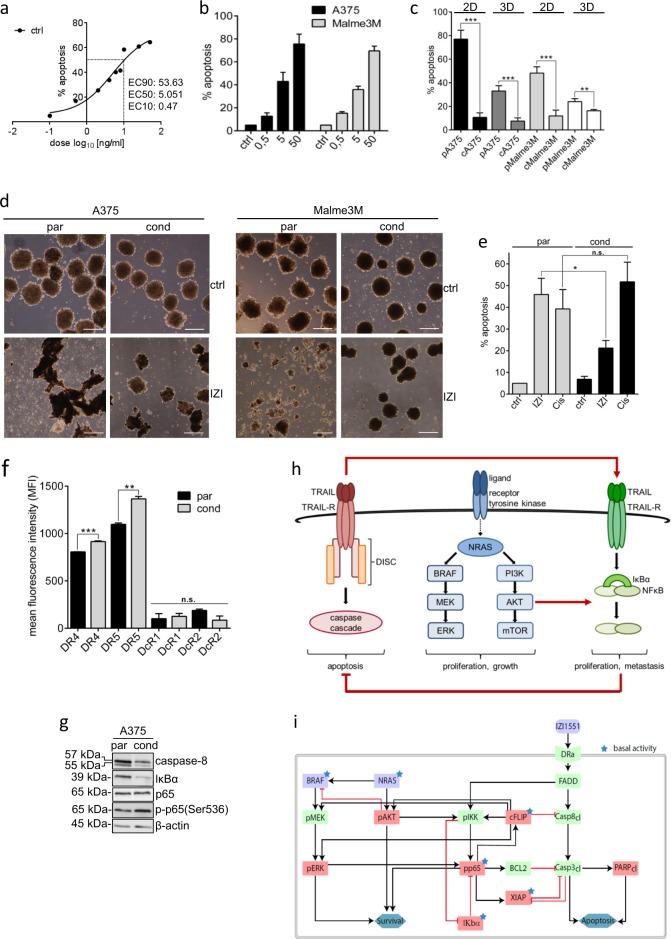
Fig. 2.
Monitoring IZI1551 susceptibility using mathematical modelling. a Dose response curve of nine different IZI1551 concentrations to determine the EC50 concentration. b A375 and Malme3M melanoma cells were treated with increasing IZI1551 doses (0.5; 5; and 50 ng/ml) and apoptosis determined 24 h later in a CDDE. c Parental and IZI1551-conditioned A375 and Malme3M cells in 2D cell culture and in 3D spheroid culture, respectively, were treated with IZI1551 (50 ng/ml). After 24 h apoptosis was determined using a CDDE (**p ≤ 0.01; ***p ≤ 0.001), and d monitored by transmission microscopy of 3D spheroids. Scale bar = 250 µm. e Parental and IZI1551-conditioned A375 cells were treated with IZI1551 (50 ng/ml) or cisplatin (30 µM). After 24 h apoptosis was determined using a CDDE (*p ≤ 0.05; n.s. = not significant). f Surface expression level of TRAIL receptors 1 (DR4) and 2 (DR5) and decoy receptors 3 (DcR1) and 4 (DcR2) of parental (par) and conditioned (cond) A375 cells was scored by FACS analysis (**p ≤ 0.01; ***p ≤ 0.005; n.s. = not significant). g The expression level of caspase-8, IκBα, NFκB(p65) and phosphorylated-p65(Ser536) in untreated parental and IZI-conditioned A375 cells was monitored by Western-blot analysis. β-actin served as loading control. One representative Western-blot out of three independently performed experiments is shown (for two more replicates, see Figure S2a). h Schematic overview of MAPK-dependent, TRAIL-induced pro-apoptotic and NFκB-driven anti-apoptotic signal transduction pathways. i Topology of the Dynamic Bayesian Network (DBN) model of the signal transduction pathways. Black arrows indicate the activation, red arrows the inhibition of target proteins (purple nodes = model inputs, red nodes = measured proteins, green nodes = not measured proteins, blue nodes = functional measurements, asterisks = constitutively active proteins). For CDDE and flow cytometry analysis the mean ± SD of three independently performed experiments is shown

