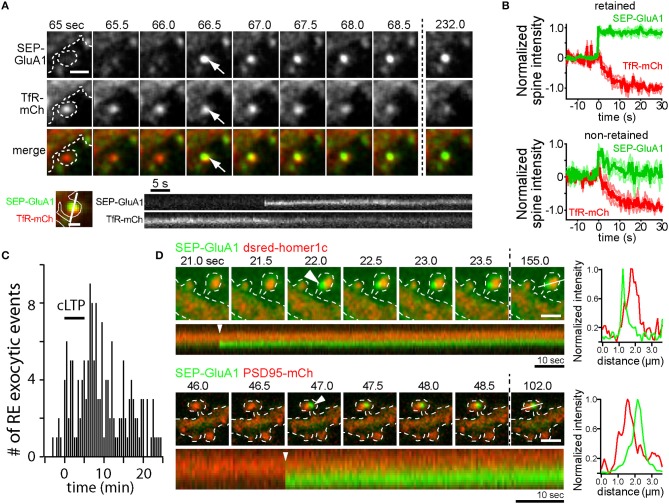
Figure 1.
AMPA receptors can be directly inserted into the spine plasma membrane adjacent to the PSD by RE fusion. (A) Time-lapse imaging of a hippocampal neuron coexpressing SEP-GluA1 (top row) and the RE marker protein TfR-mCh (middle row) following cLTP stimulation. Note the abrupt appearance of SEP- GluA1 fluorescence at the precise location of a spine RE (arrows). Scale bar, 1 μm. Below is a kymograph showing a single spine exocytic event of SEP-GluA1 (top) and TfR-mCh (bottom). Note that SEP-GluA1 is inserted and retained in the spine head, even as TfR-mCh from the same fusion event quickly diffuses away. Scale bar, 0.5 μm. (B) SEP-GluA1 exocytic events fall into two classes. Following RE fusion, SEP-GluA1 was either retained in spines (62% of total events, top panel) or quickly diffused away (38% of total events, bottom panel). In all cases, colocalized TfR-mCh signal (red traces) declined rapidly following the appearance of SEP-GluA1 (green traces). To average traces from multiple events, individual traces were aligned at the time of fusion, which was arbitrarily labeled t = 0 s. (C) The timing of RE fusion events within dendritic spines before, during and following cLTP stimulus (black bar) is plotted. Data in panels (A–C) were modified from Kennedy et al. (2010) and reprinted with permission from Cell Press. (D) AMPA receptors are inserted adjacent to the PSD. Time lapse imaging of hippocampal neurons coexpressing SEP-GluA1 and dsred-homer1c (top) or PSD95-mCh (bottom) following cLTP stimulation. Discrete SEP-GluA1 insertion events (arrowheads) occurred adjacent to, but not directly overlapping, the PSD. Scale bar, 1 μm. A kymograph measured along the line from the final time point is shown below each time series, and an intensity profile of the signal from each channel at the time of exocytosis (t = 0 s, arrowhead) is shown on the right demonstrating the two signals are optically resolvable.

