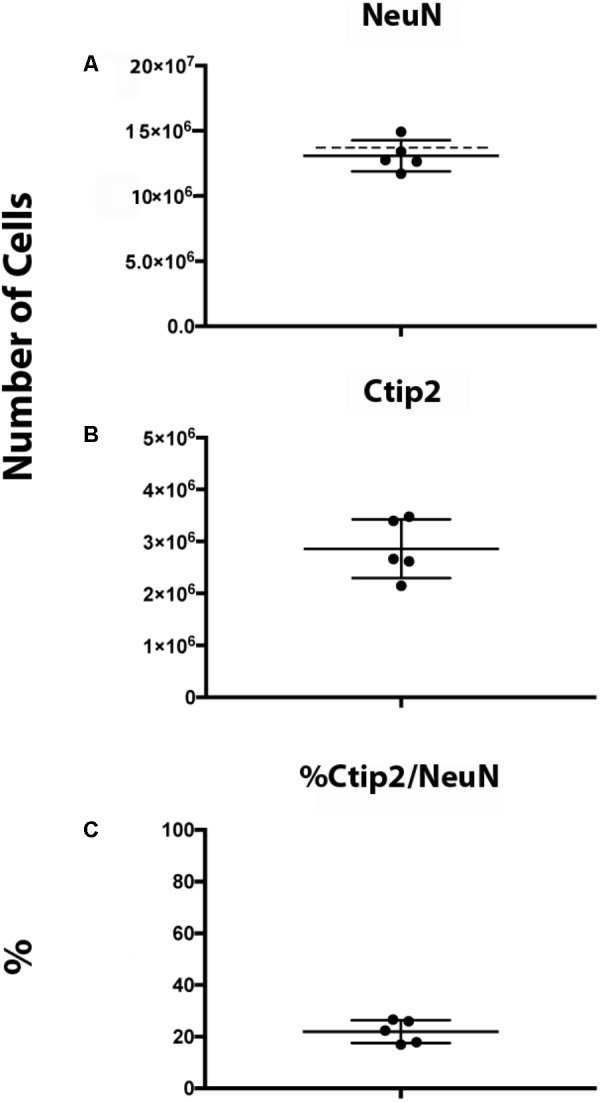
FIGURE 11.

Ctip2 and NeuN quantification in postnatal day 10 rat neocortex. Dot plots show total numbers of NeuN+ (A) and Ctip2+ (B) neurons based on number-weighted section thickness. Dashed line shows estimate of NeuN+ neurons in postnatal day 11 rat cortex obtained by Bandeira et al. (2009). Percent of NeuN+ cells that are Ctip2+ is shown in (C). Data represent mean and standard deviation (N = 5).
