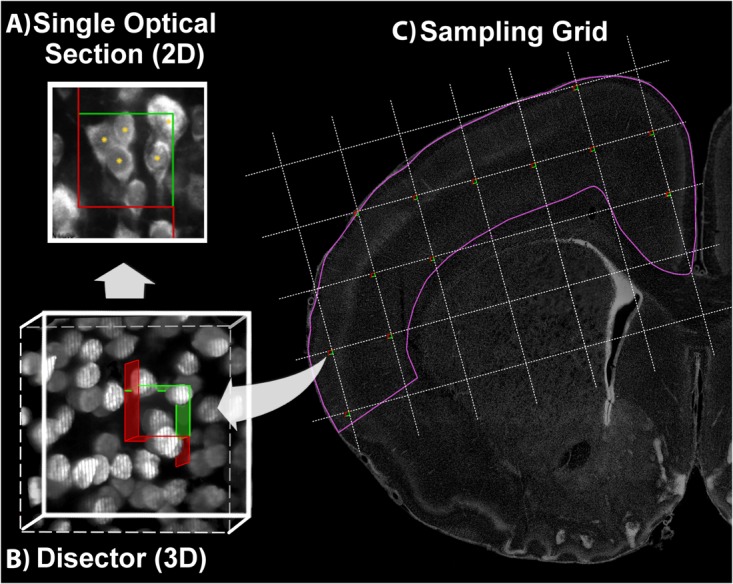
FIGURE 4.

Optical Fractionator. Using a defined criterion (here, the widest point of the Ctip2+ nucleus), individual cells in a single optical plane or “section” are marked in the sample (yellow asterisk) if they fall within the disector, touch the green lines of inclusion, and do not touch the red lines of exclusion (A). In the single optical section illustrated here, five cells are counted, including four with nuclei that fall within the disector and one that touches the upper and right green lines of inclusion. One cell is excluded because its lower boundary touches the bottom red line. Cells are sampled in a 3-dimensional disector probe (B). To sample cells, the observer focuses up and down through the entire disector, evaluating each cell that comes into focus in a single optical plane. These 3-dimensional disectors are located at each intersection point on a sampling grid superimposed over each section. This is illustrated on a coronal section of a postnatal day 10 rat brain (C). DAPI was used to delineate the cortical region of interest (pink line). The probe proceeds across the sampling grids from disector to disector in each section until all sections have been sampled.
