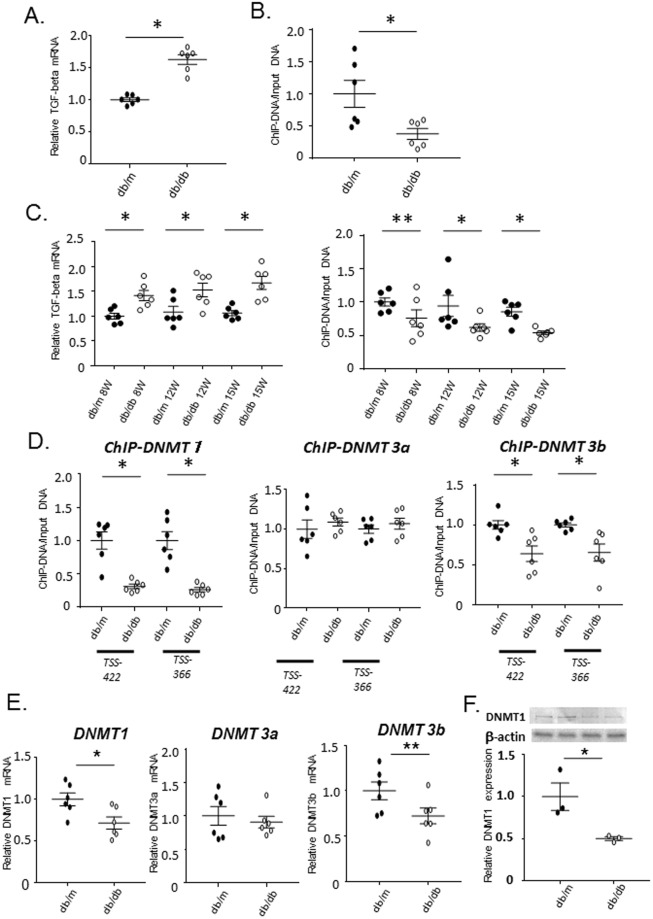
Figure 4.
DNA demethylation and upregulation of Tgfb1 in mesangial cells of db/db mice. (A) Real-time PCR of Tgfb1 mRNA (normalized to Gapdh) in primary cultured mesangial cells from db/m and db/db mice. Open circle: The expression of Tgfb1 mRNA in db/db mice significantly higher than that in db/m mice. Data represent the mean ± SEM. n = 6. Filled circles: db/m mice; open circles: db/db mice. (B) Quantitation of DNA methylation (using a MethylCollector Ultra kit) in mesangial cells from 15-week-old db/m controls and db/db mice. Results of amplification from the −422 bp relative to the transcription start site (TSS) regions are shown. DNA methylation of db/db mice is significantly lower than that of db/m mice. n = 6. (C) Time course real-time PCR experiments demonstrating Tgfb1 mRNA (normalized to Gapdh) expression and quantitation of DNA methylation using a MethylCollector Ultra kit in 8-, 12-, and 15-week-old (8 W, 12 W, and 15 W, respectively) db/m and db/db mice. Following the significant difference in Tgfb1 mRNA at 8 week and the slight, but insignificant, decrease in DNA methylation in mesangial cells of db/db mice at 8 weeks, both parameters at 12 and 15 weeks significantly differed between db/m and db/db mice. n = 6. (D) ChIP analysis of DNMTs in mesangial cells of db/db mice. The results of ChIP assays for DNMT1, DNMT3A, and DNMT3B in mesangial cells from 12-week-old db/m and db/db mice at the positions 422 and 366 bp upstream of the TSS. The binding of DNMT1 and DNMT3B to the Tgfb1 promoter region is significantly decreased in db/db mice as compared to db/m mice, despite no difference of DNMT3A between both mouse strains. n = 6. (E) Real-time PCR of DNMTs mRNA (normalized to Gapdh) of DNMT1 in primary cultured mesangial cells from db/m and db/db mice. The expression of DNMT1 mRNA significantly and DNMT3b mRNA tends to decreased in db/db mice as compared to db/m mice. Data represent the mean ± SEM. real-time PCR; n = 6, Filled circles: db/m mice; open circles: db/db mice. (F) Western blot analysis of DNMT1 in primary cultured mesangial cells from db/m and db/db mice. Open circle: The expression of DNMT1 protein significantly decreased in db/db mice as compared to db/m mice. Data represent the mean ± SEM. n = 3. Filled circles: db/m mice; open circles: db/db mice. Original gel image of western blot analysis is presented in Supplemental Fig. 3.

