
Figure 5.
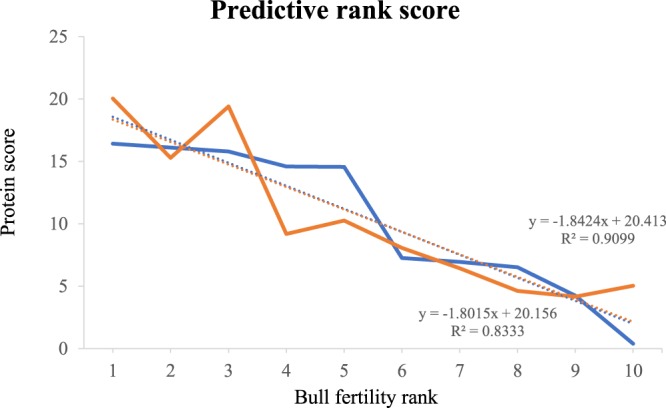
Predictive fertility rank score based on protein score (Y) and bull fertility rank (X). Protein score was obtained using normalized abundances of the six proteins with highest correlation with fertility rank. Bull fertility rank is shown from the highest (1) to the lowest value (10), as defined in Table 2. A predictive fertility rank score was significant with Spearman’s rho = 0.91 and Pearson’s correlation = 0.83. The blue line represents the conception rate difference from average (%) and the orange line represents the protein fertility score. The dotted line represents the linear regression for the respective (blue or orange) curve, showing the correlations between both scores, the conception rate and protein fertility score.