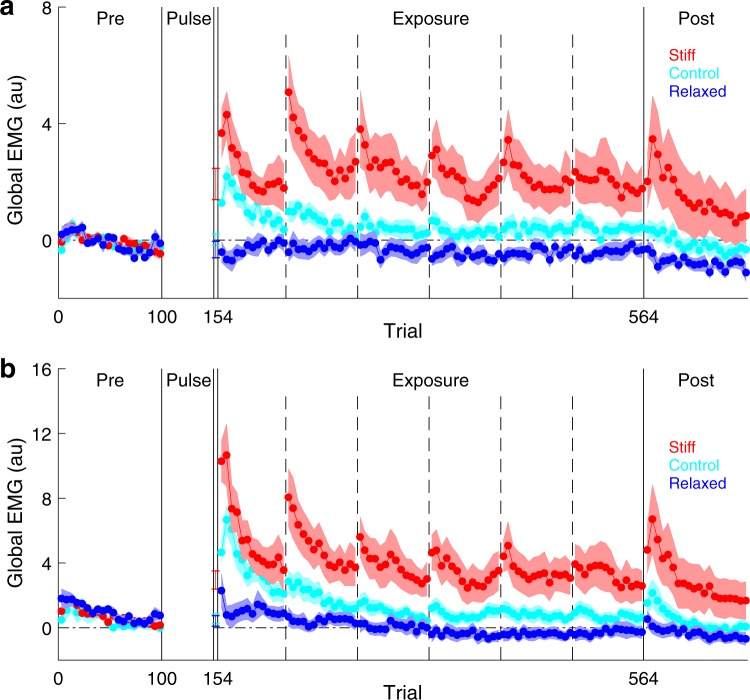
Figure 3.
Global EMG over the course of the experiment. (a,b) Global EMG, which is a proxy for stiffness, was calculated on each trial and plotted as an average of a block of five trials. Data show mean ± s.e.m. across participants in the stiff (red), relaxed (blue) and control (cyan) groups. Vertical dashed lines indicate rest breaks. (a) Global EMG from −200 ms to 130 ms relative to movement onset. (b) Global EMG from 130 ms to 400 ms relative to movement onset.

