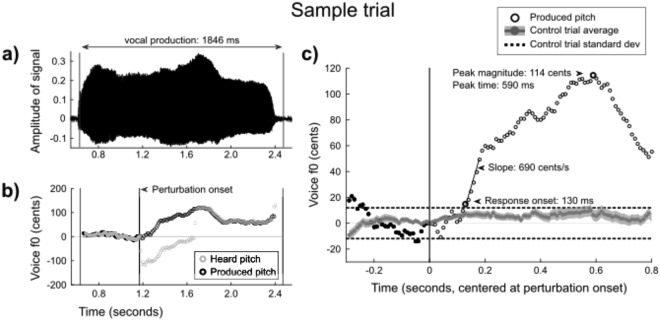
Figure 1.
A sample trial. (a) vowel waveform; (b) pitch trace for this waveform showing the participant’s vocal output (black) and what they heard (light gray). In this case, there was a down-shift so that the heard pitch was 100 cents below the produced pitch over a 500-ms duration; (c) the participant’s mean control trace (gray area-fill) was subtracted from the vocal output of each trial to create a normalized response (black). Dotted lines represent the +/−1 standard deviation of the control trials. All pitch traces are in cents, centered at the frequency that was being produced at the shift onset. In this trial, response onset is identified at 130 ms with an onset slope of 690 cents/s (F0 increased by 34.5 cents over the next 50 ms), and the peak time is at 590 ms, with a peak magnitude of 114 cents. Note: Time is measured from the beginning of the trial in (a,b), and realigned to the shift onset in (c). Filled circles in (b) and (c) represent the baseline period for that trial.

