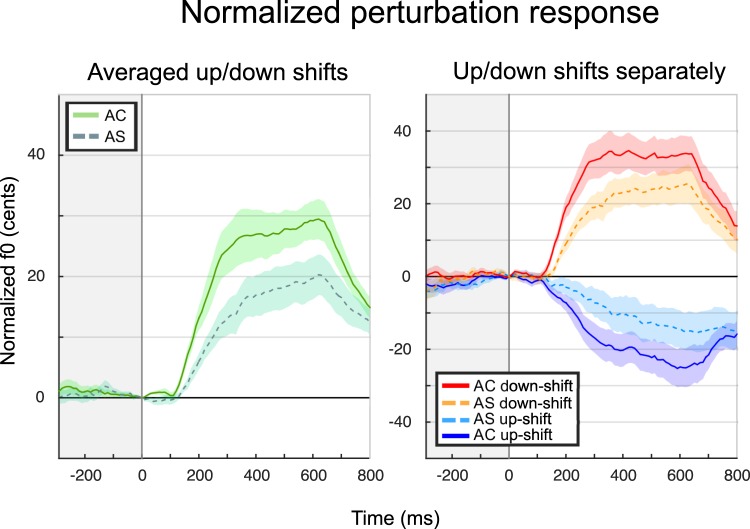
Figure 2.
Averaged normalized pitch traces (before categorization into response types). Solid lines represent the AC group, and dotted lines represent AS. Shaded areas represent standard error of the mean. In the left panel, the absolute change in pitch for all shifts are presented, reflecting the average response independent of shift direction. In the right panel, the results for shift direction are presented with down-shift (red and orange), up-shift (blue and indigo).

