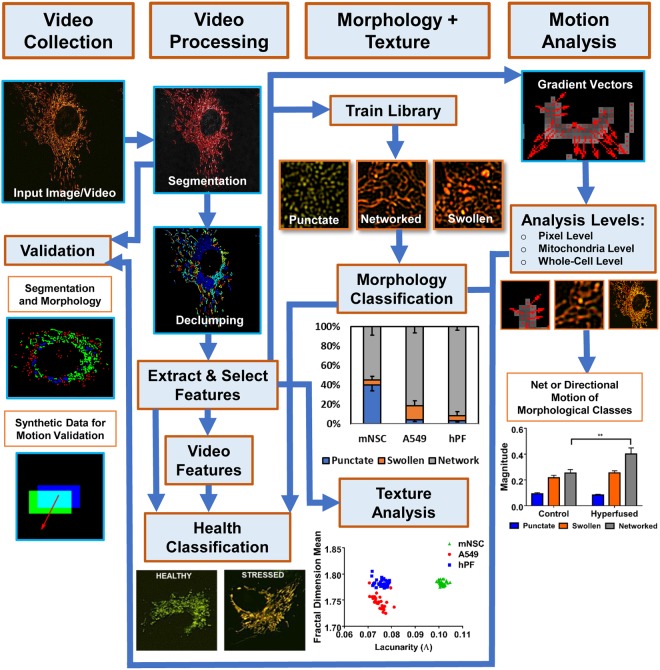
Figure 1.
Overview of MitoMo software pipeline. Video frames of labeled mitochondria were captured and loaded into the MitoMo software. The videos were segmented and declumped, and 21 morphological, intensity, texture, and motion features were extracted for each frame. The selected features were then fed into a previously trained library of the three mitochondrial morphologies (punctate, networked, and swollen). The segmented mitochondria from the test videos (frames) were automatically morphologically classified using K-nearest neighbor (KNN) and Naïve Bayes. The resulting data were plotted into graphs, depicting the percentage of punctate, networked, and swollen mitochondria. The software can also perform motion analysis by computing the magnitude and orientation of the gradient vectors, and the net or directional motion can be plotted for the population of mitochondria in each cell. Motion analysis can be performed for the entire mitochondrial population within a cell, individual mitochondria, and/or morphological classes of mitochondria. Texture features, which are indicative of mitochondrial complexity and organization, can be extracted, Validation was performed to ensure accuracy of the segmentation, morphological classification, and motion analysis. Extracted features can be combined to perform health classification during low-level stress that is otherwise not detectable.

