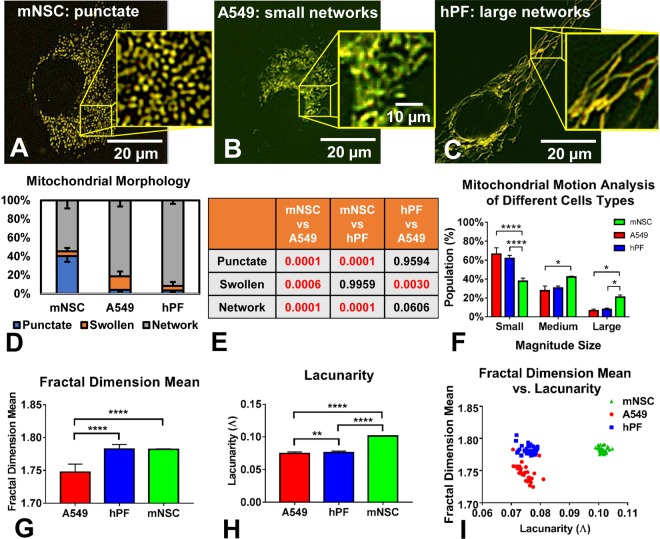
Figure 3.
Analysis of mitochondrial phenotype (morphology and texture) in three cell types. (A–C) Mitochondrial morphology in NSC, human A549 lung epithelial cells, and hPF during normal culture conditions. (D) A549 and hPF cells had significantly more networked mitochondria than the NSCs. (E) The table summarizes the p-values for each of the morphological groups compared across the different cell types in (D) (1-way ANOVA with Tukey’s multiple comparisons test). (F) Total motion analysis showed a significant increase in mitochondrial motion in the NSC compared to the other two cell types, which had similar motion profiles (2-way ANOVA with Tukey’s multiple comparisons test). (G) Mean fractal dimension analysis showed a lower complexity level in the A549 mitochondria. (H) Lacunarity analysis showed a denser mitochondrial organization in the NSCs, which contain a high number of punctate mitochondria. Texture data were analyzed using a 1-way ANOVA with Bonferroni’s multiple comparisons test. (I) Fractal dimension mean plotted versus lacunarity for the three cell types showed three distinct clusters.

