Figure 5.
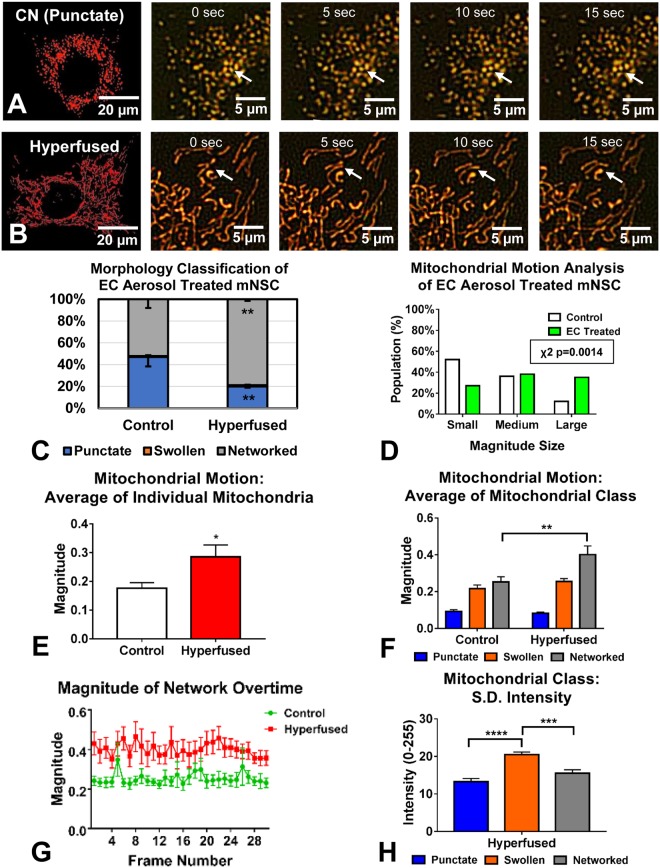
Analysis of stress-induced mitochondrial hyperfusion (SIMH) in NSCs. (A,B) Control NSC had primarily punctate mitochondria, whereas NSC treated with a tobacco product aerosol exhibited SIMH. Consecutive frames taken over 15 seconds show an enlarged section of live cells over time; arrows show examples of localized motion in the control and the translocation of hyperfused mitochondria. (C) Morphological analysis confirmed a significant shift towards the networked (hyperfused) morphology in the treated group. An unpaired two-tailed t-test was used when each morphological group was compared between the control and the hyperfused mitochondria (D) Motion analysis at the whole cell level showed an increase in motion in the hyperfused, treated mitochondria (p = 0.0014 using Chi-squared statistical analysis with a 95% confidence interval). (E) Motion analysis of individual networks of hyperfused mitochondria revealed a similar increase in motion (unpaired two-tailed t-test). (F) Motion analysis at the morphological class level showed that this increase in motion was due to the networked subgroup (2-way ANOVA with Sidak’s multiple comparisons test). (G) Magnitude of motion of the networked subgroup was greater than the control group over time. (H) Mean standard deviation of intensity analysis was performed for the three morphological classes in the hyperfused condition, showing that the swollen subgroup had the highest fluctuations in intensity (1-way ANOVA with Bonferroni’s multiple comparisons test).

