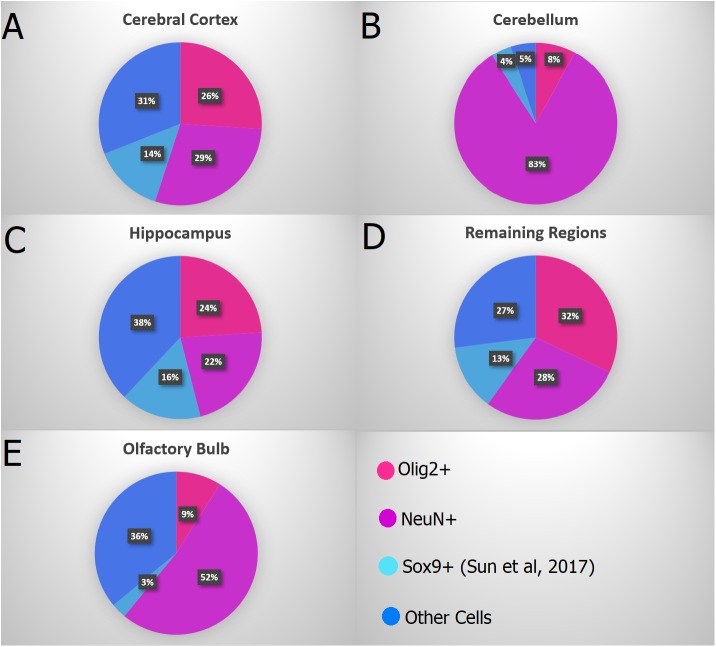
FIGURE 10.
Combined data showing the proportion of Olig2+ nuclei in pink (oligodendrocytes), NeuN+ nuclei in purple (neurons), Sox9+ nuclei in light blue (astrocytes – Sun et al., 2017) and the remaining cells in dark blue in the main regions: (A) Cerebral cortex (anterior neocortex plus remaining cortex), (B) Cerebellum, (C) Hippocampus, (D) Remaining Regions (Diencephalon + Basal Ganglia + Brainstem), and (E) Olfactory Bulb. Both studies (Sun et al., 2017 and ours) used adult mice brains from the C57BL/6 lineage, allowing an integrated analysis of both data.

