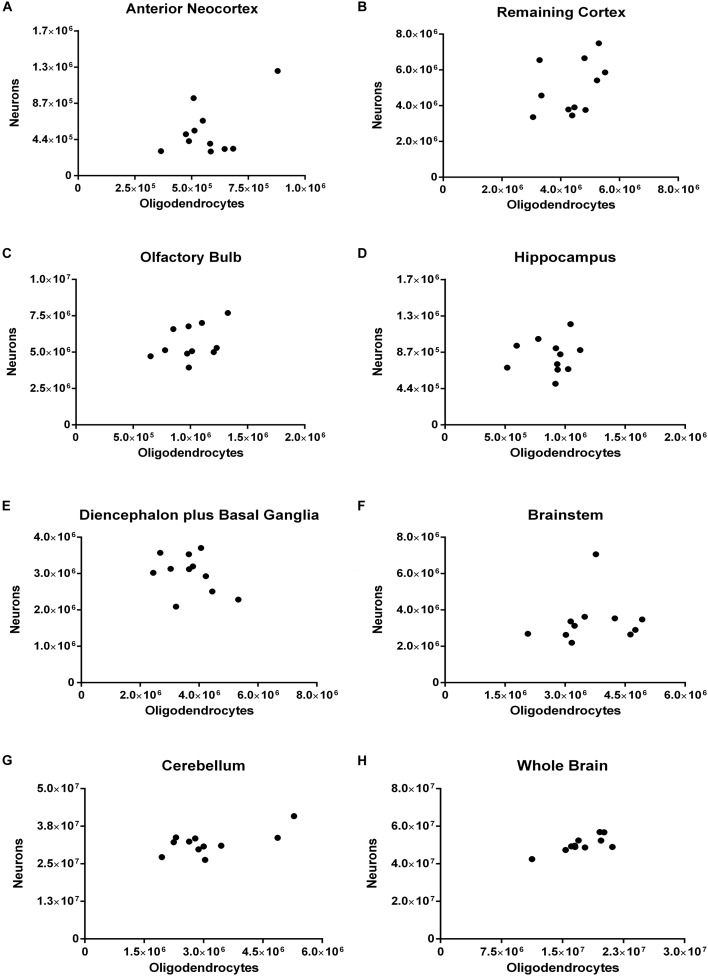
FIGURE 9.
Spearman’s correlation between the absolute numbers of neurons and of oligodendrocytes. Dissected regions are shown from (A–G). The data for the whole brain is displayed in (H). (A) Anterior Neocortex: rho = 0.0272, p = 0.9462. (B) Remaining Cortex: rho = 0.4727, p = 0.1457. (C) Olfactory Bulb: rho = 0.4273, p = 0.1928. (D) Hippocampus: rho = 0.0545, p = 0.8812. (E) Diencephalon plus Basal Ganglia: rho = –0.3000, p = 0.3713. (F) Brainstem: rho = 0.3727, p = 0.2608. (G) Cerebellum: rho = 0.2364, p = 0.4854. (H) Whole Brain: rho = 0.5909, p = 0.0609. Each dot represents one animal (n = 11).

