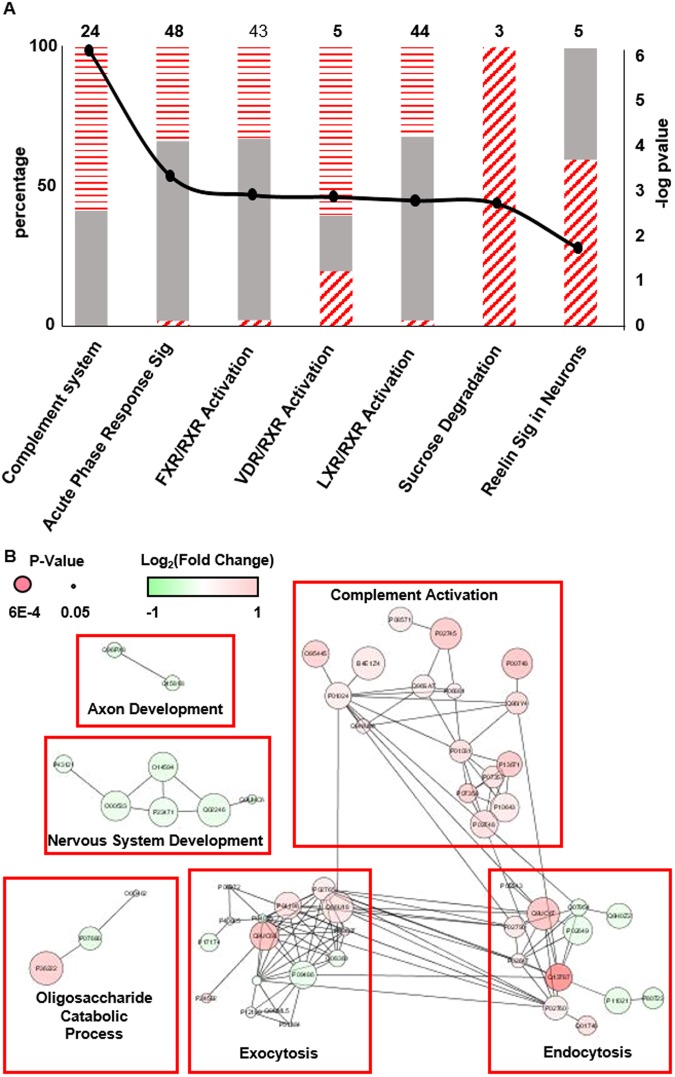
Figure 3.
(A) A stacked bar chart of significantly enriched pathways derived from the differential proteins in the CSF data. Gray solid bars represent proteins that were not detected as differentially abundant. Horizontal and diagonal dashed bars represent proteins that are up- and down regulated, respectively. Left axis is the percentage of proteins detected in that pathway (top number) as unchanged or different. Right axis displays the significance of the enrichment. (B) Interaction network analysis of differentially abundant proteins. The size of the circle is proportional to the significance (i.e., p-value) while the shade is indicative of the fold change. Clusters of proteins were isolated and subjected to GO analysis to determine biological function.

