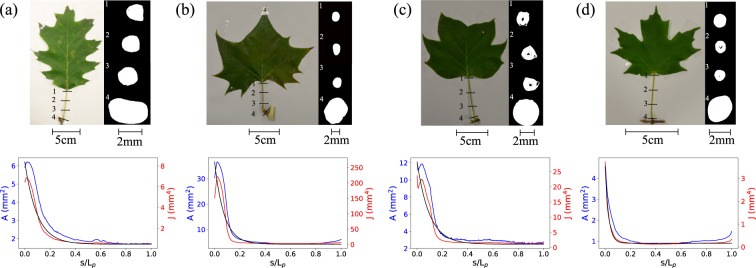
Figure 2.
Pictures of the leaves of the four species studied, from left to right: (a) Red Oak, (b) American Sycamore, (c) Yellow Poplar, and (d) Sugar Maple. Under each picture there is a plot of the area A and the polar moment of Inertia J along the petiole. An exponential fit done on J (in black) allows us to calculate α × Lp corresponding at the location where J is decreased by 99%. This coefficient α is then used to accurately determine the twisting length Lt = (1 − α)Lp.

