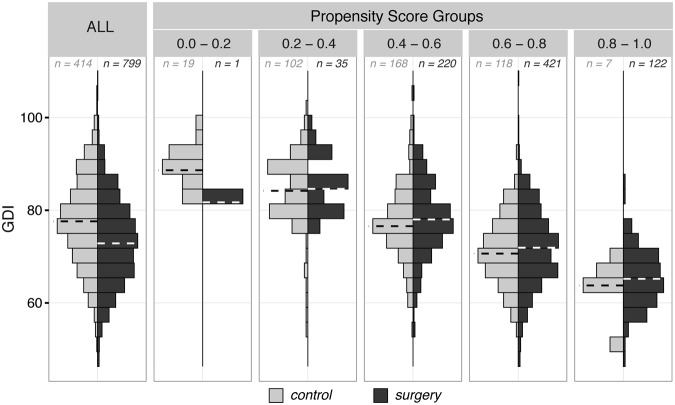
Figure 3.
Propensity-score stratified subgroups. Pre-operative gait features, e.g., Gait Deviation Index (GDI) in the control (light gray) and surgery (dark gray) groups were systematically different, with limbs in the surgery group more severely affected, on average, than limbs in the control group (ALL panel). However, control and surgery limbs with similar propensity scores showed similar pre-operative features (‘Propensity Score Groups’ panels). Numbers in each panel indicate number of limbs displayed in each histogram, dashed lines indicate group medians, and histogram heights are normalized to count in each group.

