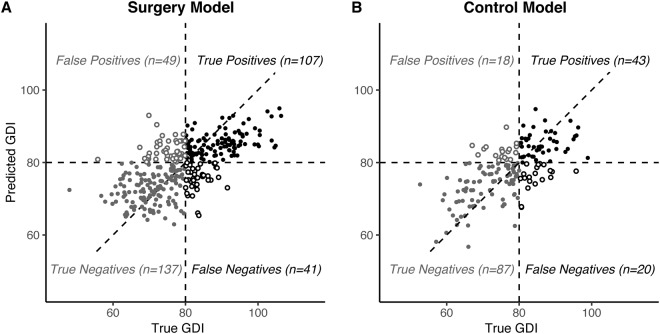
Figure 4.
Regression model performance. Linear regression models were built to predict the second-visit GDI using initial gait visit data and intervening treatments for the surgery and control groups. (A) The surgery models explained, on average, 41% of variance in outcome. Post-hoc classification of whether post-operative GDI was above 80 had 73% accuracy. The area under the ROC curve was 0.82. (B) The control models explained, on average, 40% of variance in outcome. Post-hoc classification had 77% accuracy, with area under the ROC curve of 0.81.

