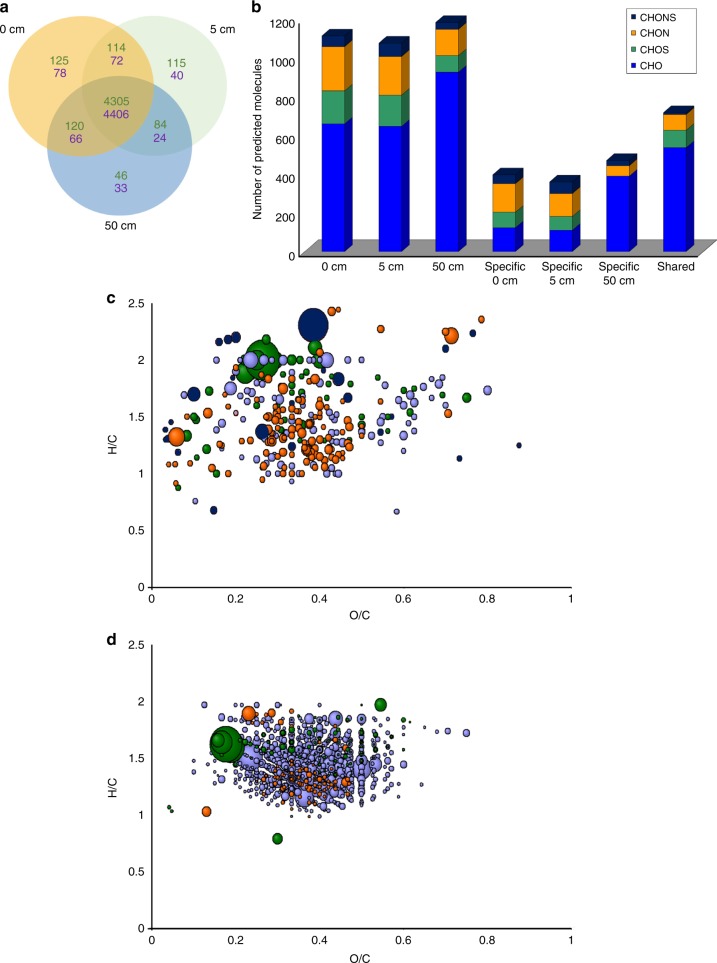
Fig. 3.
Analysis of molecular features shared among all coral samples and their elemental composition. a A schematic Venn diagram of detected molecular features using the LC-QToF-MS at 0, 5, and 50 cm from Acropora sp. (green) or Platygyra sp. (purple). b Bar chart showing the elemental diversity in chemical formulae at the three-distance sample sets of Acropora sp. as predicted by their FT-ICR-MS exact masses and isotopic fine-structure patterns. The bar graphs show the total number of compounds and their predicted elemental composition. c, d Van Krevelen diagrams showing H/C vs O/C ratios of specific compounds unique to 0 and 5 cm only (c) or common to 0, 5, and 50 cm (d). Size of dots corresponds to compound abundance extracted from measured total ion current. Colors correspond to the elemental composition in panel (b)

