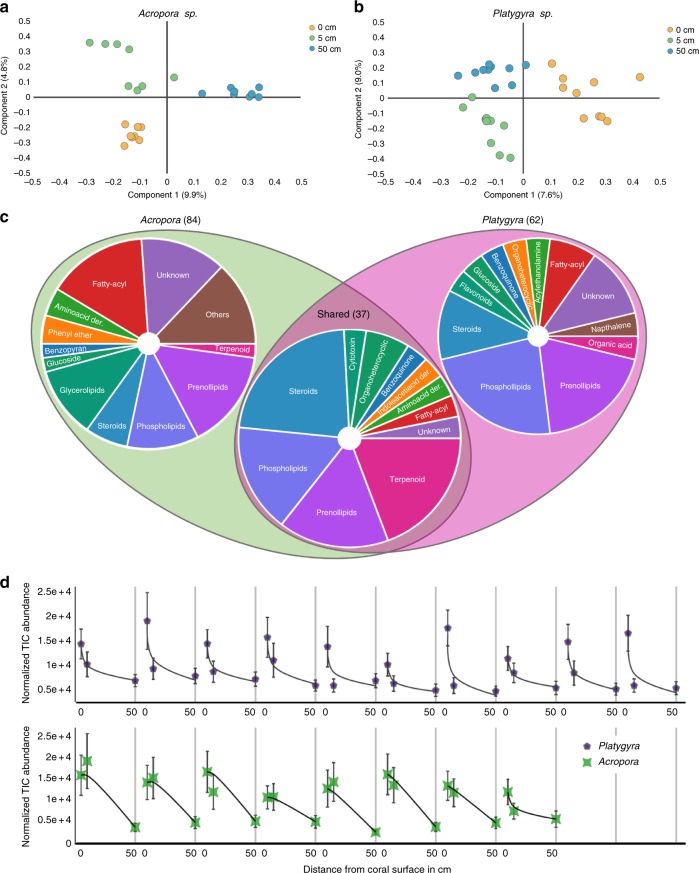
Fig. 4.
Analysis of metabolite distribution and composition. a,b Partial least squares discriminant analysis of metabolite samples according to 0, 5, and 50 cm in Acropora (a) and Platygyra (b) species. c Classification based on putative annotation of all molecular features forming abundance gradients along the vertical sample transect (0 ≥ 5 > 50, with ANOVA p ≤ 0.0086 and Welch’s t-test p ≤ 0.0098) either shared between both species or found only in Acropora or Platygyra samples. Numbers in parentheses indicate the numbers of molecules in each group. Refer to Supplementary Materials and Supplementary Table 4 for complete putative annotations, p-value significance and full mass spectrometry data. d Average normalized abundance profiles of the 37 molecular features shared in both Platygyra (10 colonies) and Acropora (8 colonies) species across all distances. For each profile, plotted points represent the normalized abundance at 0, 5, and 50-cm distances (left to right); lines represent fitting of the abundances to an exponential decay function. The vertical grey lines separate the profile of each colony. Error bars represent single standard deviations of 30 normalized intensities of the individual compounds as annotated in Supplementary Table 4

