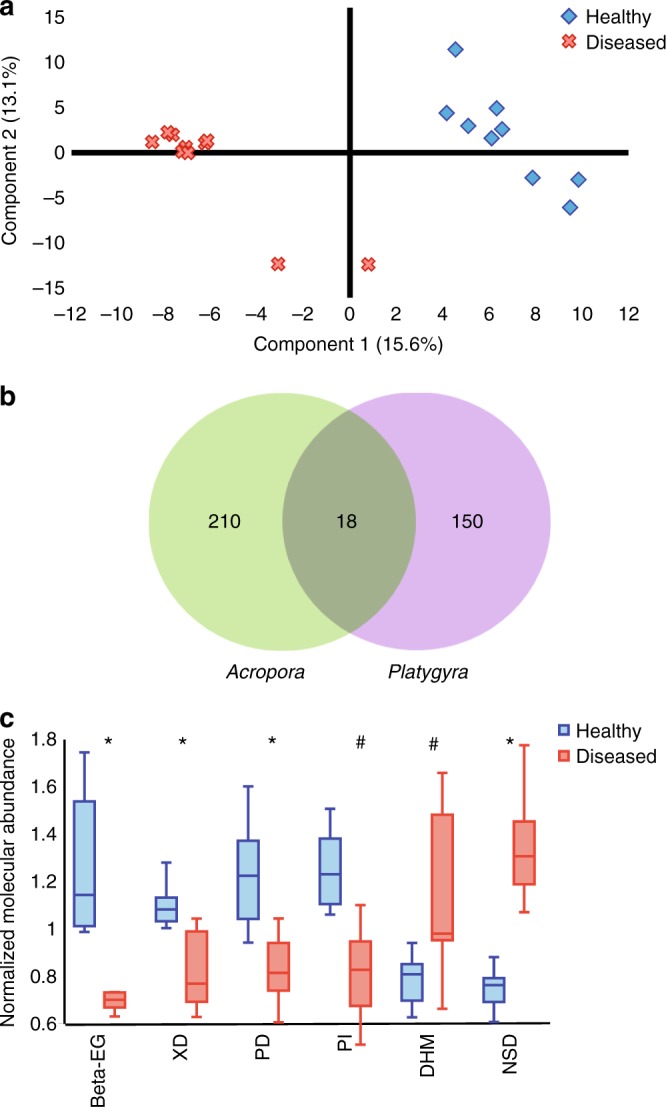
Fig. 5.

Defining coral disease indicators. a Partial least squares discriminant analysis of CS molecular features from healthy and diseased corals. b Schematic Venn diagram showing unique and shared molecular features from 0-cm samples of Acropora and Platygyra colonies. c Box and whisker plot showing candidate indicators with similar normalized abundance trends common to both coral species. The mid line depicts the median, box edges the lower and upper quartiles and whiskers min/max observed values. Statistically significant trends (Welch’s t-test) between healthy and diseased normalized abundances across colonies are marked with asterisk (p ≤ 0.00059) or hash (p < 0.0082). Error bars represent minimum and maximum values of the sample group. Beta-EG = 17-β-estradiol-3-glucuronide, XD = xanthine derivative, PD = pyridine derivative, PI = phosphatidyl-inositol, DHM = dihomomethionine, NSD = Norspermine derivative
