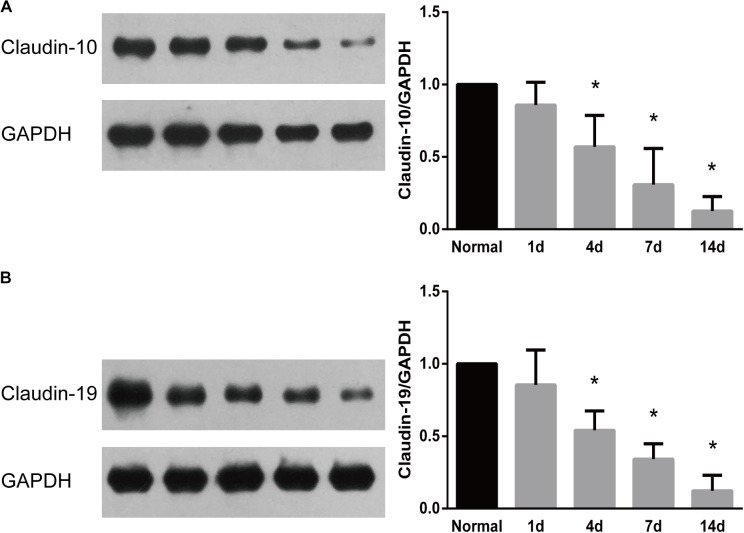
FIGURE 5.
Western blot analysis of the expression patterns of representative proteins in tight junction signaling pathway. Protein expression patterns of (A) claudin 10 and (B) claudin-19 were determined by Western blot and normalized to GAPDH. Numerical results were shown as mean (SD). ∗Statistically different from 0 day control (n = 3, Dunnett’s multiple comparisons test, P < 0.05).

