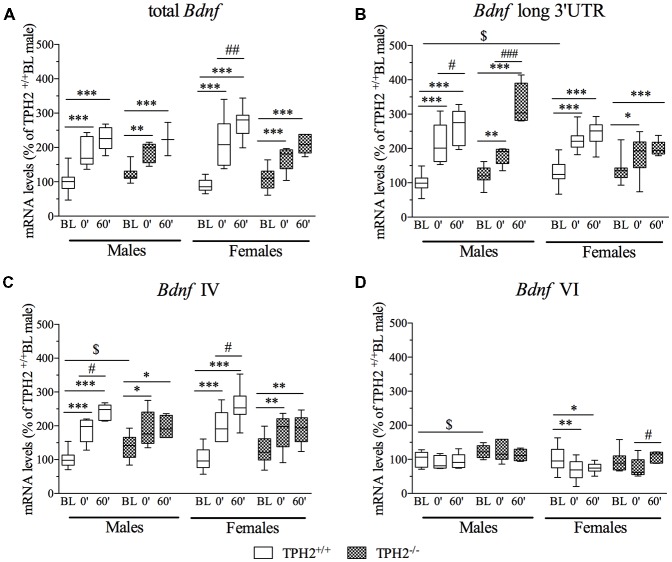
Figure 4.
Analysis of total Bdnf, (A) Bdnf long 3’UTR, (B) Bdnf isoform IV and (C) Bdnf isoform VI (D) mRNA levels in the PFC of TPH2+/+ and TPH2−/− adult male and female rats, exposed to an acute restraint stress. The data, expressed as % of TPH2+/+/BL males, represent the mean ± SEM of at least four independent determinations. *p < 0.05, **p < 0.01, ***p < 0.001 vs. BL/same genotype; #p < 0.05, ##p < 0.01; ###p < 0.001 vs. stress0’/same genotype, $p < 0.05 vs. TPH2+/+ /BL/male (three-way ANOVA with Fisher’s PLSD).

