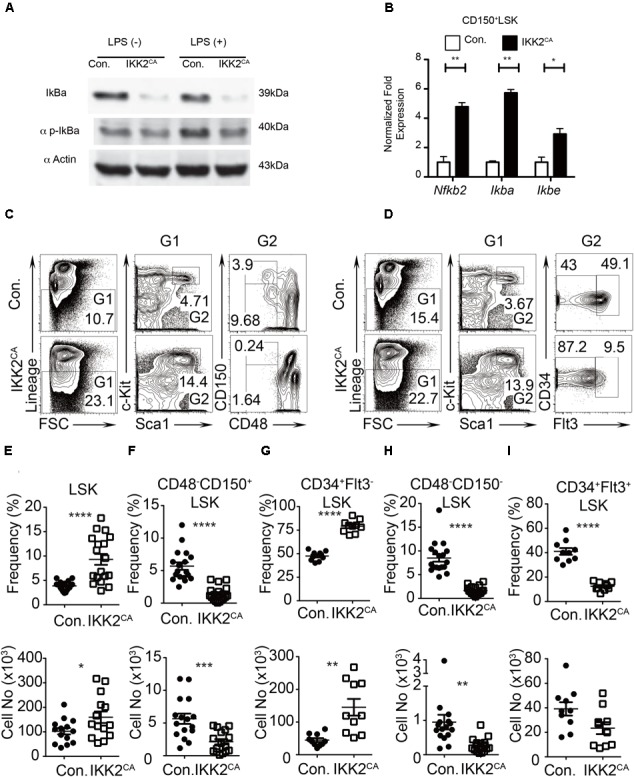
FIGURE 1.

Reduced LT-HSC pool in IKK2CA mice. (A) Western blot analysis of total IκBα protein and phospho-IκBα protein in splenocytes, from 6 weeks old IKK2CA and control mice, either in the presence or absence of LPS stimulation for 1 h. Data are representative of two independent experiments. (B) Real time PCR analysis of NF-κB target genes in HSCs in the BM of 6 weeks old IKK2CA and control mice. Data are representative of two independent experiments. (C) FACS plots of LSK cells, LT-HSCs (CD48-CD150+LSK), and MPPs (CD48-CD150-LSK) from the BM (two femurs and two tibias) of 6 weeks old IKK2CA and control mice. Data are representative of five independent experiments. (D) FACS plots of LSK cells, ST-HSCs (CD34+Flt3-LSK), and MPPs (CD34+Flt3+LSK) from the BM (two femurs and two tibias) of 6 weeks old IKK2CA and control mice. Data are representative of five independent experiments. Relative (top) and absolute (bottom) numbers of LSK (n = 14) (E), LT-HSCs (CD48-CD150+LSK) (n = 16) (F), ST-HSCs (CD34+Flt3-LSK) (n = 10) (G), SLAM-MPPs (CD48-CD150-LSK) (n = 16) (H) and MPPs (CD34+Flt3+LSK) (n = 10) (I) in the BM (two femurs and two tibias) of 6 weeks old IKK2CA and control mice. All data represent mean ± SEM. Two-tailed Student’s t-tests were used to assess statistical significance (∗P < 0.05, ∗∗P < 0.01, ∗∗∗P < 0.001, ∗∗∗∗P < 0.0001).
