FIGURE 3.
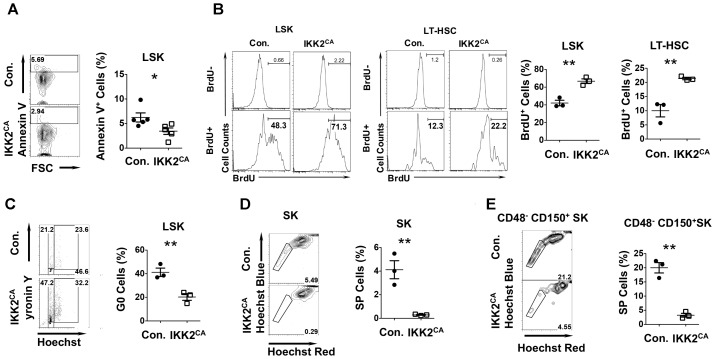
Altered cell cycle properties of HSCs from IKK2CA mice. (A) Representative FACS plots (left) and average frequencies (right) of AnnexinV+ cells in LSK fractions in the BM of 6 weeks old IKK2CA and control mice. Data are pool of 5 mice per group. (B) Representative FACS plots (left) and average frequencies (right) of BrdU+ cells in LSK cells and LT-HSCs in the BM of 6 weeks old IKK2CA and control mice. Data are representative of two independent experiments with 3 mice per group. (C) Representative FACS plots (left) indicating frequencies of HSPCs in G0 (Pyronin Y- and Hoechst-), G1 (Pyronin Y+ and Hoechst-) and G2/S (Pyronin Y+ and Hoechst+) phase of cell cycle in the BM of 6 weeks old IKK2CA and control mice. Shown are average frequencies of HSPCs in G0 phase of cell cycle in the BM of 6 weeks old IKK2CA and control mice (right). Data are representative of two independent experiments with 3 mice per group. Representative FACS plots (left) and average frequencies (right) of side population (SP) fraction in Sca1+c-Kit+ (SK) cells (D) and CD48-CD150+Sca1+c-Kit+ cells (E) in the BM of 6 weeks old IKK2CA and control mice. Data are representative of two independent experiments with 3 mice per group. All data represent mean ± SEM. Two-tailed Student’s t-tests were used to assess statistical significance (∗P < 0.05, ∗∗P < 0.01).

