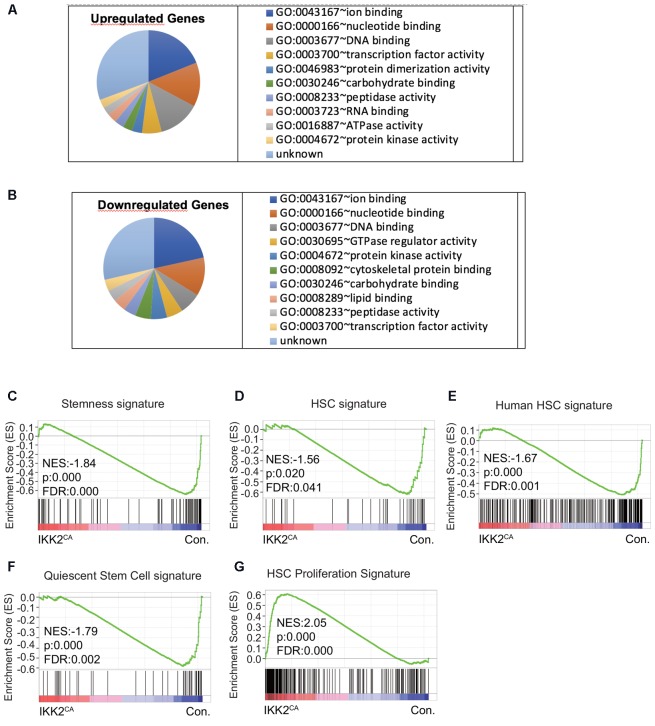
FIGURE 4.
Deregulated molecular signatures in IKK2CA HSCs. Gene ontology (GO) analysis of microarray data: top 10 major GO terms of molecular function among upregulated genes (>1.5 fold) (A) and downregulated genes (<0.67 fold) (B) in IKK2CA LT-HSCs. Gene set enrichment analysis (GSEA) of microarray data from IKK2CA versus control LT-HSCs with the following gene sets: genes enriched in normal, steady-state BM HSCs from WT mice compared to multi potent progenitors (MPPs), leukemic stem cells (LSCs), and mobilized HSCs (C). Genes enriched in HSCs, but not in MPPs (D). Genes enriched in human HSCs of cord blood (E). Quiescent stem cell genes, which are commonly upregulated in HSCs, muscle stem cells and hair follicle stem cells (F). Genes enriched in proliferative HSCs, which are commonly upregulated in fetal liver HSCs (vs. adult HSCs) and 2, 3, and 6 days after 5FU injection (vs. 0, 1, 10, 30 days after 5FU injection) (G).

