FIGURE 6.
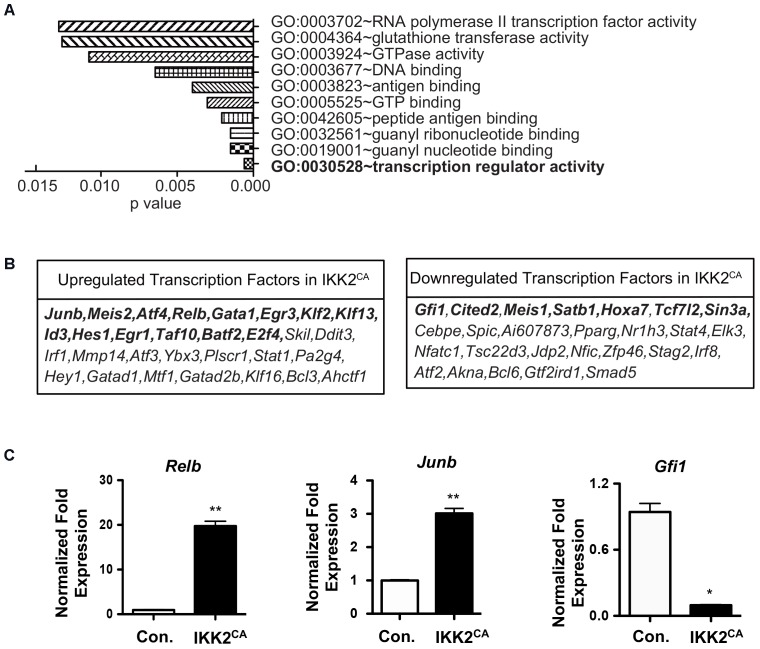
Altered transcription factor networks in IKK2CA HSCs. (A) Gene ontology analysis of microarray data: the 10 most significantly enriched GO terms (function) in upregulated genes (>1.5 fold) in IKK2CA LT-HSCs. P-values were calculated by DAVID 6.7 software. (B) Differentially expressed transcription factors (TFs) in IKK2CA LT-HSCs. Highlighted TFs have been shown to regulate HSC self-renewal, quiescence, and differentiation. (C) Real time PCR data for Relb, Junb, and Gfi1 in IKK2CA or Control LT-HSCs. Expression levels of target genes were normalized to HPRT levels. Data are representative of two independent experiments. All data represent mean ± SEM. Two-tailed Student’s t-tests were used to assess statistical significance (∗P < 0.05 and ∗∗P < 0.005).

