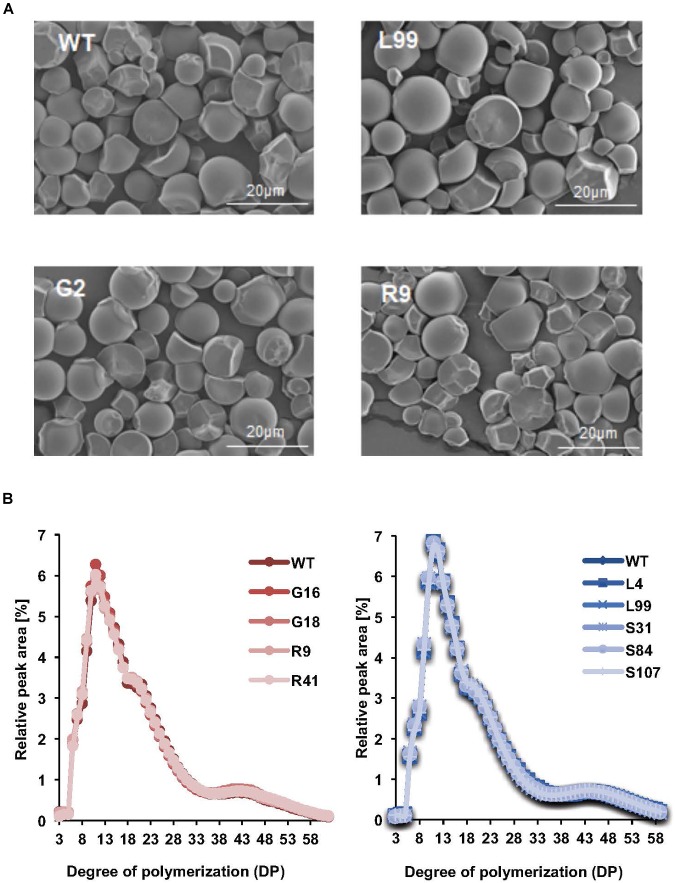
FIGURE 4.
Starch structure in transgenic cassava roots. (A) Scanning electron micrographs of purified and dried root starch granules from pooled starch samples from the 2016 harvest. Line names and scale bars are indicated. (B) Comparison of chain length distributions of starch in different transgenic lines. Left is the CLDs of G- and R-line starches from samples in 2016. Right is the CLDs of S and L line starches from samples in 2015. Values are means of four technical replicates performed on starch samples pooled from 3 or more plants.

