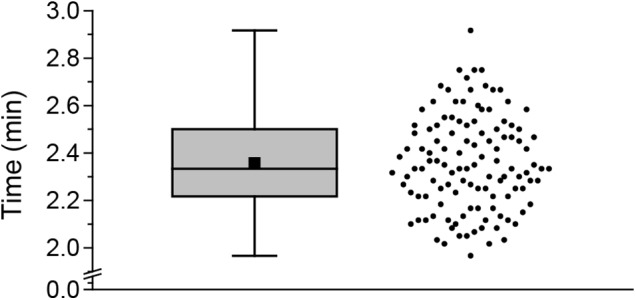
FIGURE 3.

Sampling time for one Arabidopsis rosette. Boxplot (left) and scatter plot (right) of times needed for sampling 9 leaves. Both plots show the distribution of the measured data. The scatter plot shows each time measured. The box indicates the middle 50% of the data points. The black square indicates the mean value and the line within the box the median. Whiskers are defined as 1.5 fold interquartile range. In total, time was measured for 119 sampling events.
