FIGURE 5.
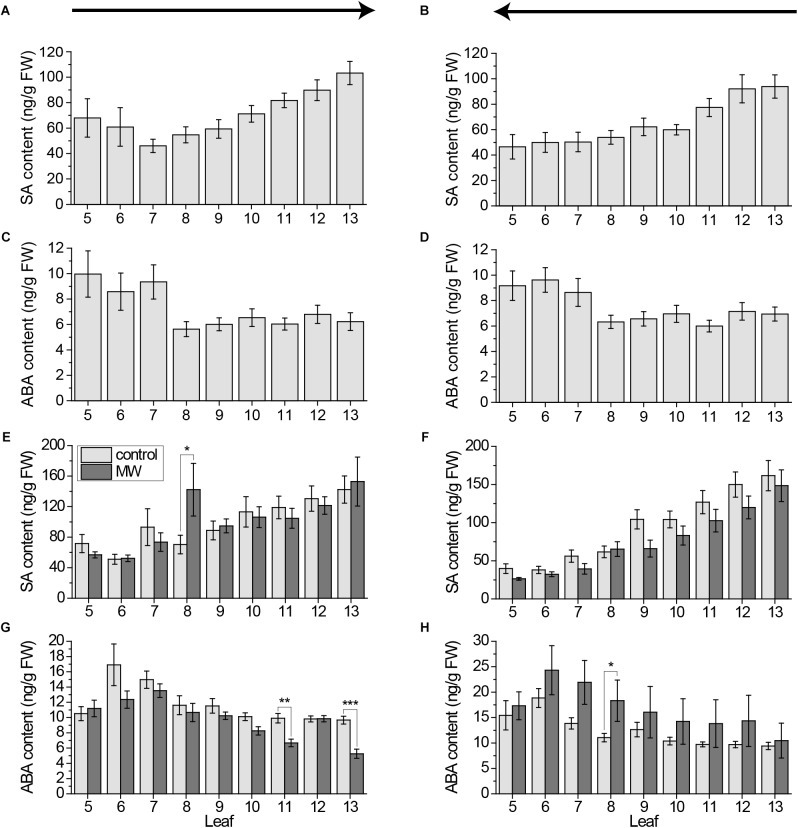
Systemic pattern of SA and ABA in individual leaves of the Arabidopsis rosette. Mean levels of SA (A,B,E,F) and ABA (C,D,G,H) ±SE in individual leaves of Arabidopsis plants. In (A–D) untreated plants were used. Experiment was repeated two times independently (n ≥ 11). In (E–H) plants were wounded for 1 h with MecWorm and phytohormone content of the leaves was compared to unwounded plants. See (E) for color coding legend. Experiment was repeated at least three times independently (n ≥ 13). All samples over all experiments were collected using the cut-and-freeze-method. Sampling direction is indicated by arrows above the figures. In (A,C,E) and (G) rosette was collected from old (5) to young leaves (13) and in (B,D,F,H) from young to old leaves. Statistically significant differences between phytohormone content of treated and untreated plants within the leaves in experiments (E–H) were determined by unpaired two-sample Wilcoxon test. Asterisk indicates significance (∗P < 0.05, ∗∗P < 0.01, and ∗∗∗P < 0.001). P-values are FDR corrected.

