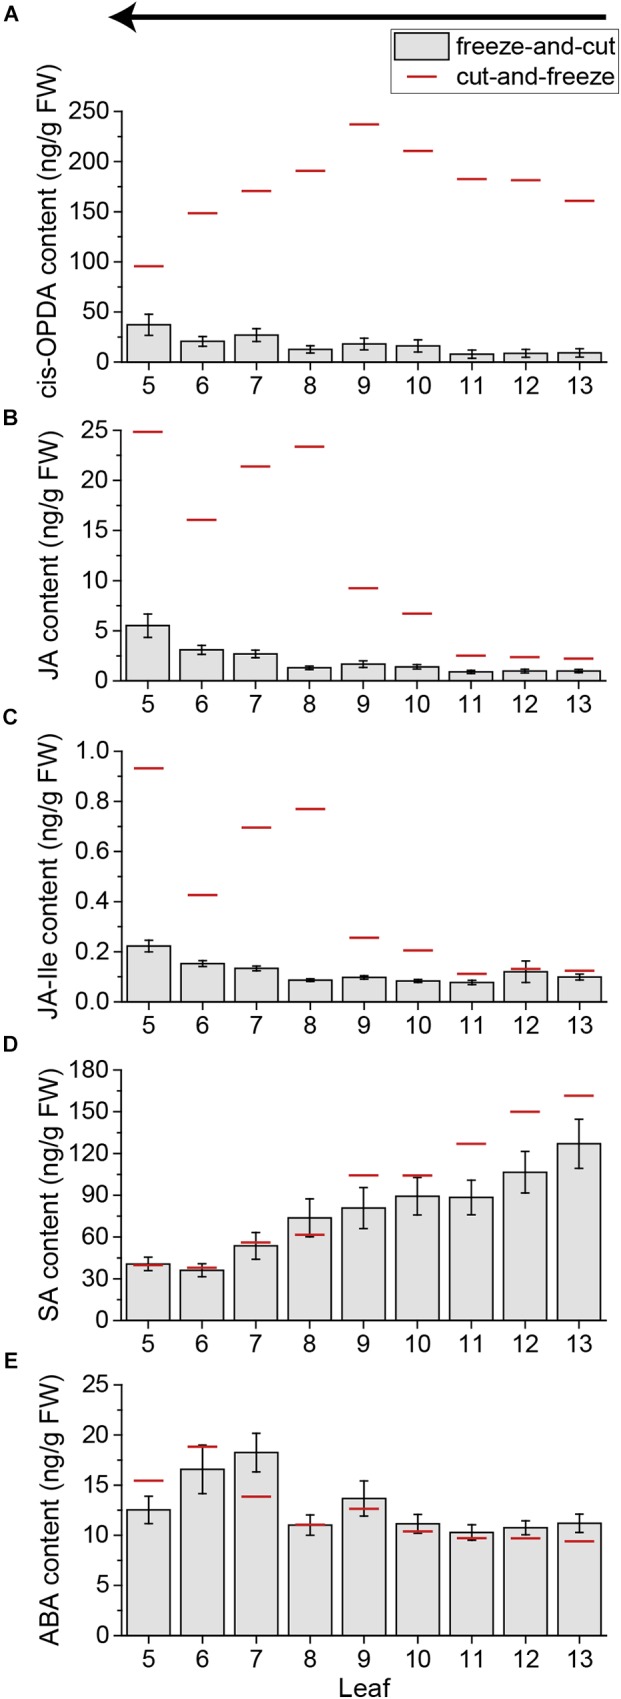
FIGURE 7.

Phytohormone content of untreated Arabidopsis leaves using the freeze-and-cut-method. Bars represent mean levels of OPDA (A), JA (B), JA-Ile (C), SA (D), and ABA (E) ± SE in individual leaves of untreated Arabidopsis plants. Individual leaves were collected with the freeze-and-cut-method from leaf 13 (young) to leaf 5 (old). Sampling direction is indicated by an arrow above the figures. The experiment was repeated six times independently (n ≥ 19). Red lines indicate the mean values of untreated plants collected with the cut-and-freeze-method in the same sampling direction (see Figures 4, 5F,H).
