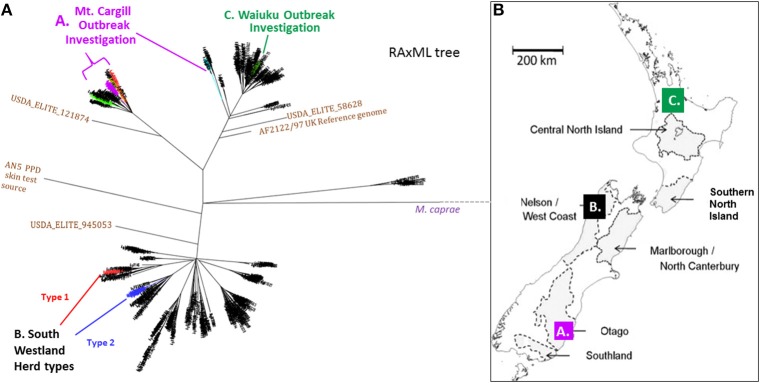
Figure 2.
(A) NZ M. bovis Radial ML Phylogram illustrating the Phylogenetic relationship of the isolates that will be discussed in more detail below. (A) Mt. Cargill investigation isolates-These isolates cluster in the Otago clade and are colored the same as in the boxed sub-groups in Phylogram in Figure 3a. (B) South Westland breakdown types- The two types isolated from the herd in South Westland and the closest relatives (shown in SNP tables in Figure 4B) are colored differently; the breakdown type 1 isolate clusters in the VNTR53 group and it and its closest known relatives are colored red, the breakdown type 2 isolates clusters in the VNTR59 subgroup and it and its closest known relatives are colored blue. (C) Waiuku outbreak- isolates cluster in the CNI clade and outbreak isolates described in the SNP table in Figure 6B are colored green. (B) Map of NZ indicating vector risk areas (shaded regions) and illustrating geographical source of the isolates from the three outbreak investigations described below. Colored squares on the map indicate the regions of the discussed outbreak investigations. The three different investigations that will be discussed below are indicated by letters and color in the Phylogram in (A) and the map in (B).

