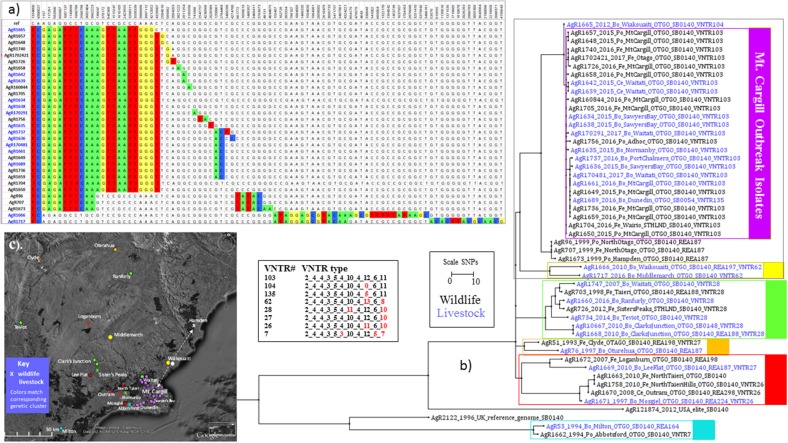
Figure 3.
Mt. Cargill Outbreak Investigation. Genetic and spatial relationship of M. bovis isolates from southeast Otago. (a) SNP table and Phylogram for selected isolates from the Otago cluster. The SNP table illustrates SNP differences in outbreak isolates and their closest known relatives. Chromosomal positions in genomic reference NC_002945.3 are listed across the top. The DNA base found at the indicated chromosomal position in the reference is listed in the next line. DNA bases in the table are colored to indicate differences from the reference genome. (b) Square ML Phylogram. The scale bar indicates the distance in SNPs between isolates displayed in the phylograph. Livestock metadata in the tree (_Bo_ for bovine _Ce_ for cervine) is colored blue and wildlife metadata (_Po_ for possum, _Fe_ for ferret), is colored black. The numbers for the listed VNTR types are the number of repeats at the 11 loci as described in Price-Carter et al. (15): Miru40_EtrD_EtrC_EtrE_NZ2_QUB18_QUB11a_QUB26_DR2_DR1_QUB3232. Red numbers in this VNTR table indicate differences from the outbreak type VNTR103. (c) Map of sources of isolates shown in the phylogenetic tree in (b). Symbols on the map indicate the approximate regional sources and are colored to match the genetic cluster of the isolate as indicated by the boxes in (b). The arrows on the map in (c) indicate the proposed direction of the spread of this infection based on WGS results.

