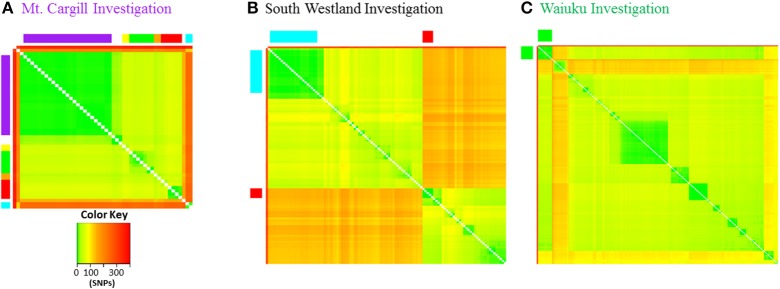
Figure 8.
Pairwise genetic distance heat maps. Distance in SNPs between pairs of isolates is illustrated by the different colors as indicated in the color key. (A) Mt. Cargill outbreak isolates are in the same order as in the Phylogram in Figure 3 and colors along the outside of the plot correspond to those in the Phylogram and also to those in the more detailed distance plots in Supplementary File 6. (B) VNTR53 and VNTR59 isolates. Close relatives of South Westland breakdown type 1 are indicated by red squares and type 2 by the blue rectangles along the outside of the plot. Isolates are in the same order as in the more detailed distance plots in Supplementary File 6. (C) CNI branch isolates. Waiuku outbreak isolates are indicated by the green squares along the outside of the plot.

