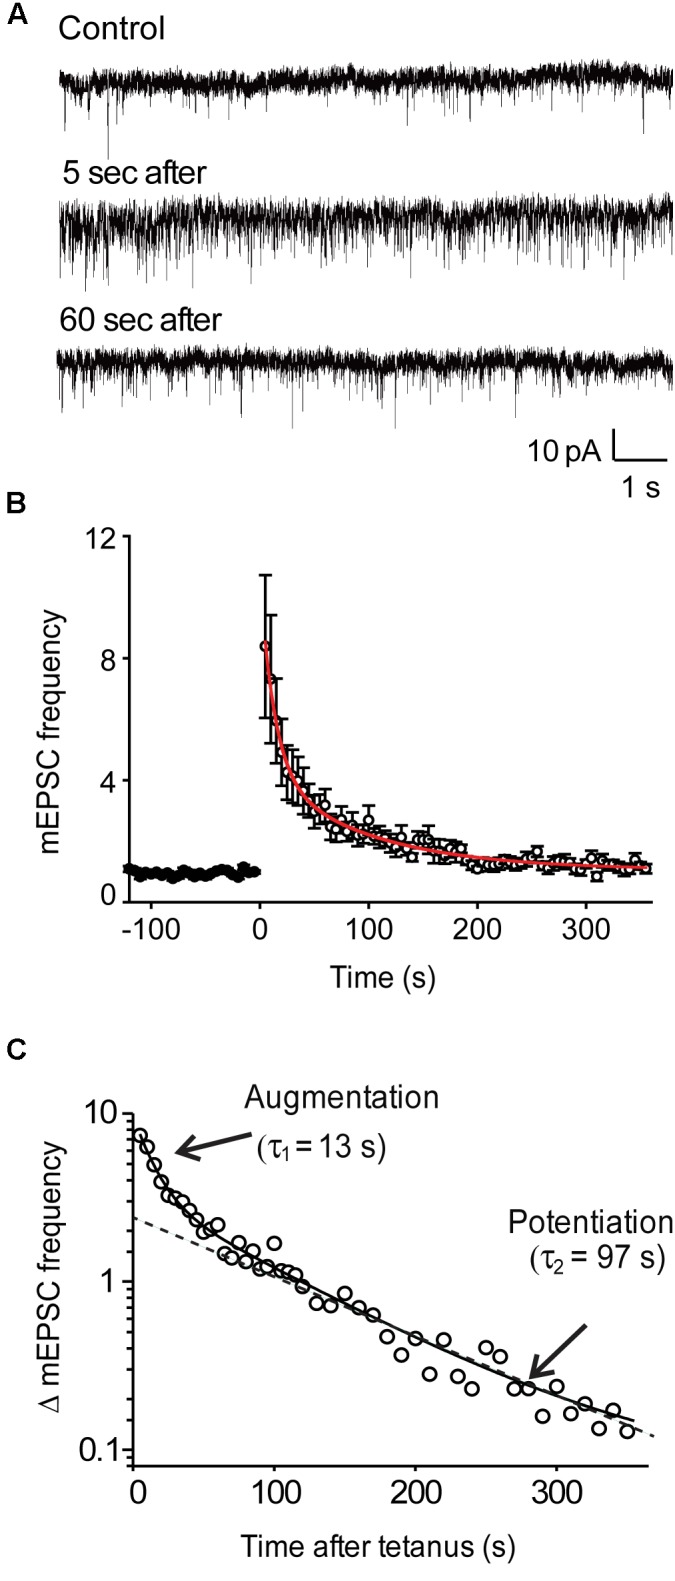
FIGURE 1.

Activity-dependent enhancement of miniature EPSC frequency in wild-type hippocampal neurons. (A) Representative recordings of mEPSCs before, as well as 5 and 60 s after the end of a stimulus train (50 Hz, 2 s). (B) Time course of mEPSC frequency changes produced by stimulation (at time = 0). Points indicate mean values of mEPSC frequency (n = 9), normalized to baseline values measured prior to the stimulus train, and error bars indicate ± SEM. Red curve indicates fit of bi-exponential decay function. (C) Semi-logarithmic plot of the post-tetanic changes in mEPSC frequency shown in panel (B). Solid curve indicates bi-exponential decay function, while dashed line indicates time course of slower potentiation component.
