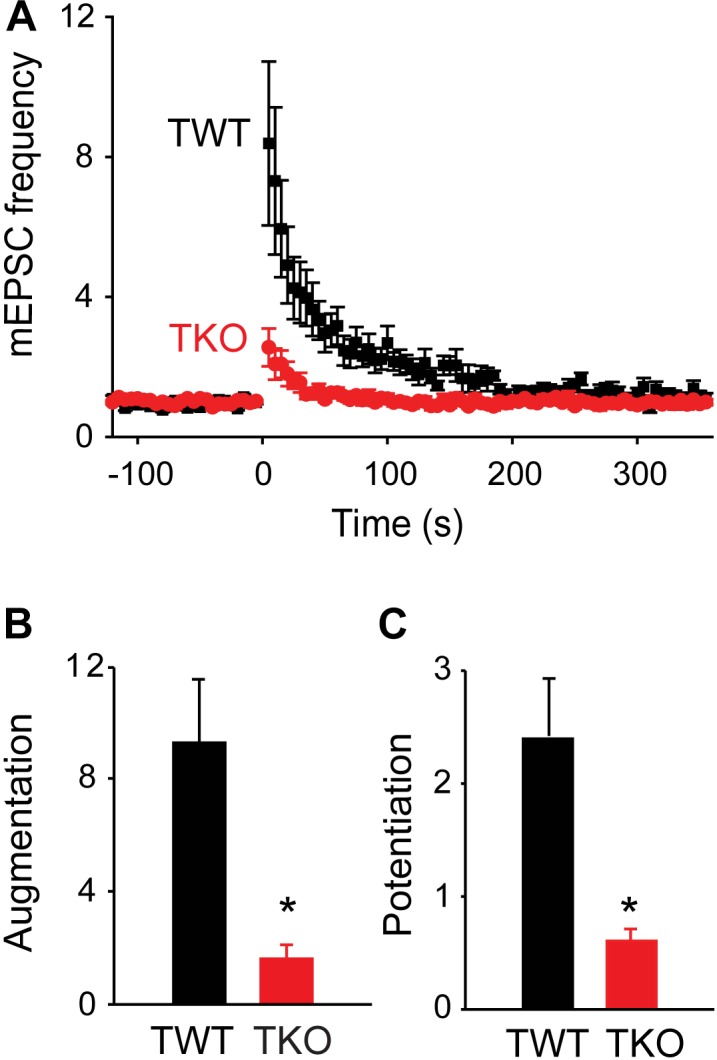
FIGURE 2.

Role of synapsins in augmentation and potentiation. (A) Time course of changes in normalized mEPSC frequency produced by electrical activity (50 Hz, 2 s stimulation) in TWT (black) and TKO (red) neurons. Points indicate mean values of mEPSC frequency (n = 7), normalized to baseline values measured prior to the stimulus train, and error bars indicate ± SEM. (B) Peak amount of augmentation of mEPSC frequency, calculated from exponential fits to the data in panel (A), in TWT (black) and TKO (red) neurons. (C) Amount of potentiation of mEPSC frequency in TWT (black) and TKO (red) neurons. Values in panles (B,C) indicate means and error bars indicate ± SEM, while asterisks indicate significant differences (p < 0.05) between TWO and TKO.
