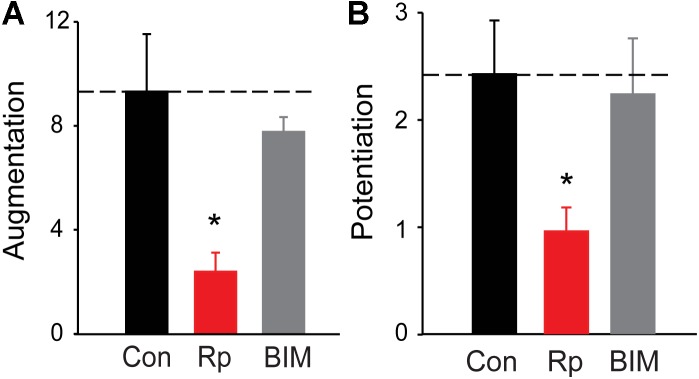
FIGURE 4.
Roles of PKA and PKC in augmentation and potentiation. (A) Amplitude of augmentation measured in TWT neurons in control conditions (black), as well as in the presence of the PKA inhibitor Rp-cAMP (red) and the PKC inhibitor BIM (gray). (B) Amplitude of potentiation the same conditions indicated in panel (A). Values indicate means, determined as in Figure 2, error bars indicate ± SEM, and asterisks indicate significant differences compared to values measured in control conditions (dashed lines).

