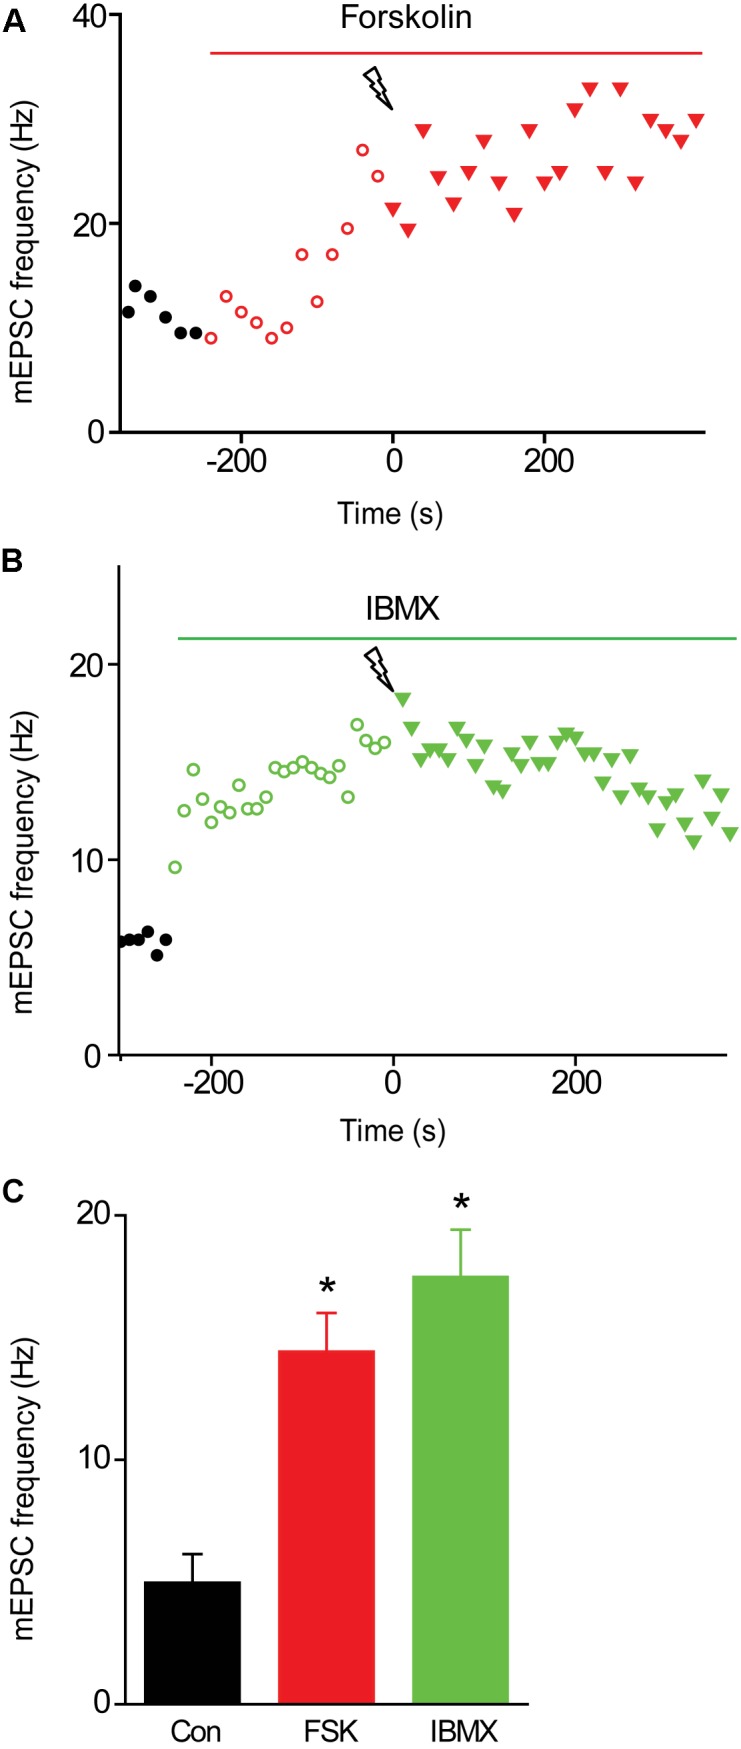
FIGURE 5.

Effects of elevating presynaptic cAMP levels on mEPSC frequency in TWT neurons. (A) Time course of changes in normalized mEPSC frequency (red symbols) produced by application of forskolin (10 μM) during time indicated by red bar. Electrical stimulation (50 Hz, 2 s) was applied at time = 0. (B) Time course of changes in mEPSC frequency (green symbols) produced by application of IBMX (0.5 mM) during time indicated by green bar. Electrical stimulation (50 Hz, 2 s) was applied at time = 0. (C) Mean values of mEPSC frequency measured in control conditions (black), as well as in the presence of forskolin (FSK; red) and IBMX (green). Values indicate means, error bars indicate ±SEM, and asterisks indicate significant differences compared to values measured in control conditions.
