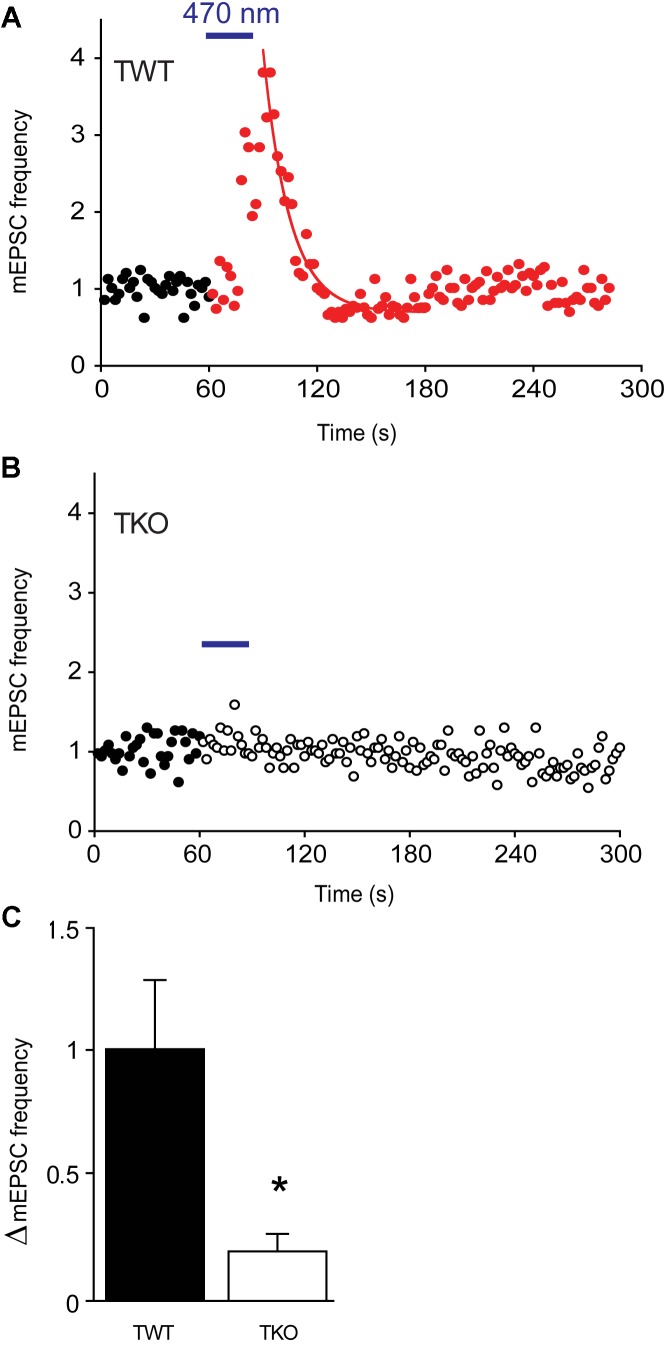
FIGURE 7.
Changes in mEPSC frequency produced by optogenetic elevation of presynaptic cAMP levels. (A) Time course of normalized mEPSC frequency in response to illumination (470 nm light, 30 s at blue bar) of a TWT neuron expressing opto-β2-AR. Red points indicate mEPSC frequency, normalized to baseline values, measured following the start of the light flash. Smooth curve indicates an exponential fit to the decay of mEPSC frequency following the end of the light flash. (B) Same for a TKO neuron expressing opto-β2-AR. Open symbols indicate normalized mEPSC frequency measured following the start of the light flash. (C) Mean increase in mEPSC frequency produced by activation of opto-β2-AR in WT (black) and TKO (white) neurons. Error bars indicate ±SEM, while asterisks indicate significant differences.

